Stating that America’s international trade and federal budget deficits are too big does not mean they should be zero. Both deficits derive in part from the exorbitant privilege (Eichengreen, 2012) reaped by the United States from the Bretton Woods and post–Bretton Woods economic order, the historical development of which is explained in Part 1 below. Each of these deficits has a nonzero, “warranted” level. Part 2 below presents a method for calculating these warranted levels—levels that global economic growth will gift the United States with the exorbitant privilege of never having to repay.
The warranted deficit model (WDM) used in this article, shows for the period 2001–2016, America’s warranted trade deficit (WTD) averaged about $199 billion per year, whereas the average actual trade deficit was more than double that amount, or about $527 billion per year. The WTD indicates the level of deficit that is welcomed by the rest of the world and should be welcomed by well-informed American citizens. Other countries need those dollars to hold at their central banks to back their own currencies; as their economies grow they need additional amounts of central bank–held dollars; meanwhile, American citizens should welcome the opportunity this affords for consuming $199 billion of imported goods per year that they won’t have to pay for, as explained by the Babe Ruth check analogy in Part 1.
Based on the 5.91% average rate of growth of the rest-of-the-world (ROW) economy – that is, other than the U.S.—during 2000–2016, the model shows America’s WTD for that period averaged 1.47% of U.S. gross domestic product (GDP)—let’s say 1.5% of annual U.S. GDP. As Part 1 explains, there is a reason we call the U.S. trade and budget deficits the “twin deficits.” Because of the twin deficit relationship laid out below, there is a warranted budget deficit (WBD) of about the same size as the WTD; it, too, is welcomed by the rest of the world and should also be welcomed by American citizens as well.
Given that the federal budget is about one-quarter the size of U.S. GDP, the WBD for 2001–2016 worked out to be about 6% of the budget (consistent with also averaging 1.5% of GDP) during the indicated period. The WBD represents government services financed from abroad that the United States Treasury (that is, American taxpayers) will never be asked to repay. Meanwhile, as with the actual versus warranted trade deficits, the actual budget deficits were about double the WBD for the indicated period.
As World War II ended, Maynard Keynes (of the British Treasury) and Harry White (of the U.S. Treasury) devised the Bretton Woods system to keep individual national economies—and thus the world economy—from toppling back into the Great Depression when war-time spending wound down. The agreements negotiated at Bretton Woods, New Hampshire, in 1944 and approved by the U.S. Congress in 1945 not only created the World Bank and the International Monetary Fund, they also put the United States at the center of a new international economic order. That order linked the dollar to gold, while other currencies were indirectly linked to gold via fixed exchange rates with the U.S. dollar. Keynes came up with the idea and wanted the central role for the United Kingdom and its currency, the pound sterling. But White had the clout of the U.S. Treasury (holding roughly two-thirds of the world’s monetary gold at the time) and the U.S. economy (possessing the only major industrial sector not bombed out by World War II) and used that power to grab that role for the United States and the dollar.
The rules negotiated at the Bretton Woods Conference severely limited private international financial transactions. They did this so that individual governments could use the new Keynesian macroeconomic management principles to reflate each country’s economy without having their efforts undermined by international currency speculators.
Under the Bretton Woods rules, the gold backing of the U.S. dollar made the dollar as good as gold. Fixed exchange rates with other currencies made those currencies indirectly good as gold. From 1945 until the summer of 1971, countries with currencies that remained stable (that is, kept their trade and payments in good order) could exchange their currencies for dollars at the fixed exchange rate and then convert dollars to gold at the fixed price of $35 per ounce, if they wished.
Under the Bretton Woods system, a nation’s money supply could grow by acquiring additional claims to the gold in the system—that is, by trade surpluses or by mining gold themselves. A nation could grow its economy, in turn, by (a) expanding their money supply (using one or both of the above two methods), (b) domestic price deflation (having all prices go down together—most effectively by increasing the productivity of the various factors of production [land, labor, and capital]—so that more output was achieved with the same level of inputs and with the same level of money supply), or (c) increasing the “velocity of money”—that is, the rate at which the money supply turns over, which we assume here to be relatively constant (see Higgins, 1978).
Global economic growth could occur by increasing the global supply of gold or by adjusting gold’s U.S. dollar price along with all the fixed exchange rates of all the countries in the system. The latter option never occurred as a matter of year-by-year, overt policy. What happened instead was that evolving market and fiscal processes birthed a new reality granting the U.S. the exorbitant privilege of running unrelenting and unrequited trade and budget deficits.
The U.S. Marshall Plan, President Johnson’s Great Society, the Viet Nam war, and other U.S. ventures had the unintended effect of accumulating large sums of dollars abroad. A “Eurodollar market” developed—in Europe initially, as the term suggests—and grew from there. Dollars circulated between second- and third-party countries with the only U.S. involvement being to “export” potential foreign central bank reserves (that is, U.S. dollars) to import goods and services. The reality slowly emerged that America would never really have to pay for some of those imports. The reason was that—lacking gold mines of their own—other countries needed the dollars for growing their own trade and, indeed, for stabilizing and growing their own economies. Most of those countries welcomed the U.S. trade deficits.
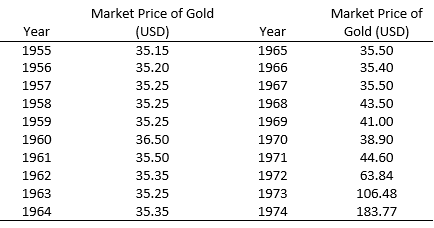
Source: Only Gold, 2018.
The leadership of France saw things a bit differently, however. They thought—correctly—that this system gave the U.S. the exorbitant privilege of running trade deficits for free and began demanding gold for dollars at the official price of $35 per ounce—quite a deal, as the price of nonmonetary gold was beginning to rise above that level (Table 1). These and related pressures led President Nixon to rescind dollar-to-gold convertibility in August 1971—and along with it, the indirect gold backing of all the other currencies. Thus, began the 1971–1990s evolution from the Bretton Wood system to the re-globalized world envisioned in the emerging Washington Consensus (see Williamson, 2004).
Dollars held abroad became the monetary gold of the late 20th and early 21st centuries; the U.S. trade deficits began to function like a gold mine, supplying the liquidity needed for the global economy to grow. As these developments were institutionalized from the 1970s onwards, dollars came to make up the bulk of global central bank reserves ($6.13 trillion, or 63% of the global total of $11.297 trillion at the end of 2017, according to the International Monetary Fund). Gold no longer backed the dollars; trust in the U.S. economy and in U.S. institutions came to provide that backing.
Since 1979, the dollar percentage of global reserves has ranged between 50%+ (reaching this low point in 1991) and 70%+ (reaching this high point in 1999) of global total reserves (calculated from IMF, 2017). The euro (introduced 1999–2002) currently makes up 20%; Japan’s yen contributes 4.5%; and China’s renminbi yuan rose to 1.12% by December 2017 (Leong, 2017). Meanwhile, gold makes up only about 15% of global central bank reserves (Leong, 2017).
Dollar holdings that are not needed for immediate trade and related transactions are used to buy U.S. Treasury Instruments (notes, bonds) that are issued in financing U.S. federal budget deficits. That way, idle dollars at foreign central banks get to earn a little (risk-free) interest while they sit there backing the local currencies.
Recall that U.S. Treasury instruments are the numeraire in Modern Portfolio Theory (MPT)—the canonical risk-free investment from which the risks associated with other investments are assigned interest rate differentials. The dollar’s status as the most-desired reserve currency would evaporate without (a) trust in the U.S. government and (b) the world’s deepest capital markets, in which trust of American institutions is paired with daily liquidity of U.S. dollars and federal debt instruments. This combination makes the exorbitant privilege of annual trade deficits spill over onto an exorbitant privilege of annual U.S. federal budget deficits.
The sometimes-idealized globalist era of 1870–1914 (also the “direct” gold standard era) was plagued by recurring deflations and depressions. Gold and silver discoveries could not keep pace with the explosive growth in economic capacity that came with the overlap between the first and the second Industrial Revolutions. Specie shortages were temporarily relieved by South African (1886) and Klondike (1896) gold discoveries and by clumsy U.S. attempts at bimetallism. Nevertheless, specie shortages in the face of rapidly growing productive capacity drove the overall U.S. price level down by half between 1800 and 1900. Along with this century-long general deflation came year-to-year price-level vacillations between +15% and −15% (excluding the +27% inflation during the U.S. Civil War). Also accompanying these price dynamics were five financial panics, roughly equivalent to the Great Depression of the 1930s, about once every two decades (1819, 1837, 1857, 1873, and 1893).
With dollars good as gold in the post-1970s global political economy architecture, the money supply is not whimsically determined by the insights of geologists or the luck of gold and silver prospectors. Today the supply of global quasi-gold (that is, U.S. dollars) is determined by government management of the U.S. economy and the health of U.S. politics.
The global demand for dollars keeps the dollar’s price (exchange rate) high. U.S. companies can compete in export markets and against imports in U.S. domestic markets if they can continually grow their productivity and develop attractive products; companies failing to do those things cannot compete. That is the unavoidable tradeoff that comes with reserve currency, exorbitant privilege status.
Armed with the above history, then, don’t be surprised to hear that the United States has not had an annual trade surplus since the mid-1970s. Repeat: Zero U.S. trade surpluses in the past 40+ years. America is NOT (and has not been for nearly five decades) just another international trade competitor seeking to balance trade or run a trade surplus. Americans should forget about trade surpluses or even balanced trade. Instead, America should seek to limit annual trade deficits to the WTD, which can be calculated using the warranted deficit model (WDM) introduced in Part 2.
Foreign central banks hold dollars—today’s quasi-gold—as backing for their own currencies. They convert dollars to U.S. government debt to safely earn interest on their central bank holdings. They increase and then hold onto those dollars and federal debt instruments because they must: Re-globalization and technological advances grow their economic potential just like that of the United States. To avoid unemployment of their own labor and equipment, they expand financial capacity (dollar holdings) as the country’s economic potential grows.
Unless the U.S. becomes a fools-play nation, foreign-held federal debt will not be cashed in by foreigners simply because it exists or even because it is “large.” Like the checks that Babe Ruth wrote (autographed) when paying off golf gambling debts, some of that debt is more valuable to hold than to cash in. Far greater risks to America’s economic well-being come from ill-informed political economy solutions. Ditto divisive U.S. politics that destroy the global trust that enables America to still write Babe Ruth checks.
Part 2 estimates the deficit boundaries warranted by America’s exorbitant privilege. It also estimates the “overshoot” present in the actual deficits of 2000–2016.
Global economic growth requires growth in assets held at national central banks, and the U.S. trade and Federal Budget deficits play the biggest role in supplying those assets for the rest of the world.
The WDM contains the following variables:
In this model, we hold constant the following relationships:
The model is specified as follows:
(1) WTD = WBD = [RGDPy × RGRy to y+1] × [GCBR/GGDP] × BR%$.
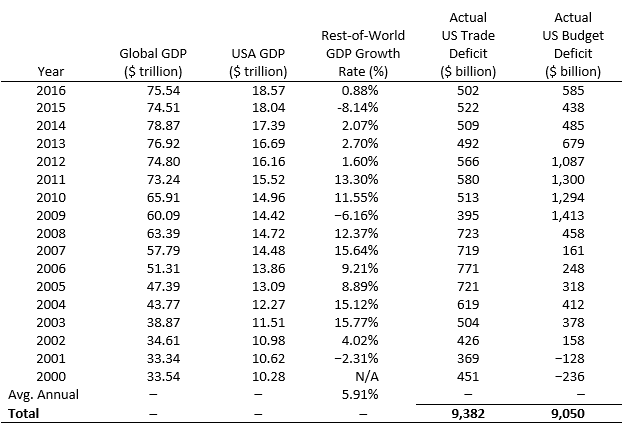
Notes: The U.S. federal budget was in surplus during 1998–2001.
Source: World Bank, 2017.
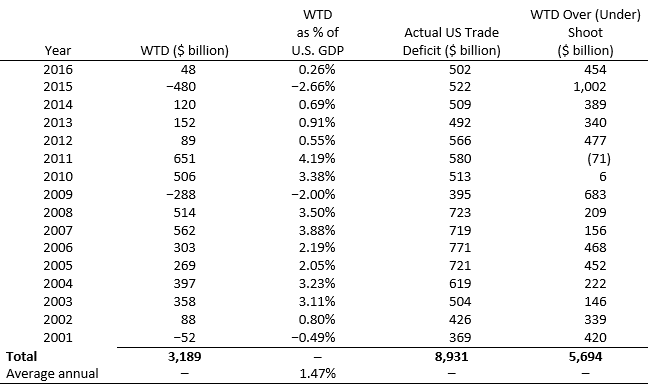
Source: Calculated from Table 2 data and warranted deficit model.
The model states that this year’s WTD equals this year’s growth in rest-of world GDP multiplied by the fixed ratio of global central bank reserves to global GDP multiplied by the fixed proportion of U.S. dollars and federal debt instruments in global central bank reserves.
As indicated in Table 2, the rest-of-the-world economy shrank during 2000–2001, 2008–2009, and 2014–2015. Thus, WTD estimates for 2001, 2009, and 2015 in Table 3 are negative. For all other years during the period, WTD estimates are positive.
The accumulated U.S. trade deficit warranted by global GDP growth during the period 2000–2016 totaled $3,189 billion ($3.2 trillion). The actual trade deficit undershot the WTD only once (2011) during the period. The WTD calculations suggest that—over a period in which rest-of-world GDP growth averaged 5.91% per year—the WTD for the U.S. averaged about 1.5% of U.S. GDP (calculated above as averaging 1.47% of U.S. GDP annual values).
The actual accumulated U.S. trade deficit 2001–2016 was $8,931 billion ($8.9 trillion), resulting in an overshoot of $5,694 billion ($5.7 trillion) with respect to the WTD. The average annual WTD for the period was $199 billion, while the average annual actual trade deficit for 2001–2016 was $527 billion (that is, approximately half of a trillion dollars per year). Thus, the actual U.S. trade deficit was more than double the deficit warranted by rest-of-world GDP growth alone.
The model’s presumption that the federal budget deficit equals the trade deficit is best measured over several years rather than for single years (that is, conversions between currency and U.S. Treasury instruments are not necessarily instantaneous). Over the reference period, the actual equality between the two is missed by less than 4% ($9,382 billion of trade deficits versus $9,050 billion of federal budget deficits—Table 2).
The U.S. trade and federal budget balances intertwine with the status and health of U.S. markets for capital and currency. The reserve currency status of the U.S. dollar has important effects on these markets, including:
The United States has the only economy in the world so starkly facing the above situation. Global leadership confers exorbitant privileges, but it also carries obligations that require enlightened management of the U.S. government and the U.S. role in the global economy. Global economic leadership and the exorbitant privilege that comes with it make totally balancing U.S. trade and the federal budget impossible without destroying today’s global economic architecture and the central position of the United States in that architecture. Pass the word.
Eichengreen, B. 2012. Exorbitant Privilege: The Rise and Fall of the Dollar and the Future of the International Monetary System, Reprint edition. Oxford: Oxford University Press.
Higgins, B. 1978. “Velocity: Money’s Second Dimension.” Economic Review June, 15–31.
International Monetary Fund. 2017. International Financial Statistics. Available online: http://www.imf.org/en/Data
Leong, R. 2017. “Dollar Share of Global FX Reserves Shrinks to Smallest Since 2014: IMF.” Reuters (December 29). Available online: https://www.reuters.com/article/us-forex-reserves/dollar-shareof-global-fx-reserves-shrinks-to-smallest-since-2014–imf-idUSKBN1EN1FC
Only Gold. 2018. Historical Gold Prices. Available online: http://onlygold.com/Info/Historical-Gold-Prices.asp
Williamson, J. 2004. “A Short History of the Washington Consensus.” Paper commissioned by Fundación CIDOB for “From the Washington Consensus towards a New Global Governance,” Barcelona, September 24–25. Available online: https://piie.com/publications/papers/williamson0904–2.pdf
World Bank. 2017. World Development Indicators. Available online: http://databank.worldbank.org/data/reports.aspx?source=world-development-indicators

