This article compares net returns from rainfed wheat-fallow and wheat-summer crop rotations when a producer enrolls in Price Loss Coverage (PLC) or Agricultural Risk Coverage (ARC) safety nets. The summer crops are grain sorghum and soybeans. The PLC and ARC programs managed by the U.S. Department of Agriculture (USDA) protect farmers against revenue loss caused by weather-related disasters and market downturns. Participation in these programs influences how farmers manage risk. Programs like PLC and ARC can also potentially incentivize farmers to shift their planting decisions toward alternative crop rotations, such as wheat-summer crop rotations. New rotations could increase profits but also potentially carry additional risk. Regarding policy, safety nets like PLC and ARC can affect federal spending on farm support, affecting program eligibility and program administration as policymakers balance protecting farmers from risk against fiscal responsibility.
The regional focus of this study is on rainfed wheat production in the Southern Great Plains (SGP), which includes parts of Texas, Oklahoma, and New Mexico (Kumar et al., 2020). SGP producers cope with dry, hot summers, cool and dry winters, and unpredictable rainfall (Hansen et al., 2012; Poland et al., 2021). Wheat-fallow and wheat-sorghum rotations cover approximately 70% of the SGP rainfed cropping acres (Baumhardt et al., 2015; Ghimire et al., 2018). The U.S. Geological Survey (USGS) estimates that more than 50% of the SGP’s irrigated operations could convert to rainfed crop rotations over the next few decades (USGS, 2016), potentially exposing producers to additional risk. The USDA’s PLC and ARC programs are options that SGP producers might consider as they anticipate and prepare for adverse growing conditions, input and commodity price uncertainty, and land use decisions.
PLC and ARC were introduced in the Agricultural Act of 2014 (2014 Farm Bill). The end of direct payments, which were intended to be phased out from 1996 to2013, arguably made commodity program payments a type of risk management tool (Schnitkey and Zulauf, 2016). The 2014 Farm Bill, and subsequently the 2018 Agricultural Improvement Act (2018 Farm Bill), authorized safety-net programs that tied payment triggers and payment levels to market conditions through the ARC and PLC programs. Unlike commodity title program payments under the 1996 Freedom to Farm Bill (FAIR Act) and the ACRE program of the 2008 Farm Bill, ARC and PLC coverage is also tied to base acres rather than actual planted or harvested acres (Outlaw and Fischer, 2023). Babcock (2014) concluded that payments anchored to base acres reduce deadweight losses stemming from commodity payment programs for the life of the farm bill as compared to direct payments made under previous farm bills.
From 2014 to 2018, producers could choose either ARC or PLC for the entire 5-year period in one election (made in 2015) based on their most significant concern: protection from lower revenues due to yield loss (ARC) or lower market prices (PLC). In addition, expanded crop insurance programs allow producers to buy additional crop insurance coverage, which increases the coverage portion of their crop insurance deductible. This additional option is called a Supplemental Coverage Option (SCO) (Babcock, 2014). Payments under SCO consider farm-planted acres and are triggered when county revenue or yield falls below 86% of the SCO guarantee. Suppose producers enroll in SCO and indemnity payments are triggered. In this case, the SCO option covers the difference between producer-elected crop insurance coverage levels (for example, 75%) and 86%. The option to purchase SCO is tied to the decision to elect PLC for their commodity program since SCO is not available to those who elect ARC (USDA-RMA, 2022).
Starting with the 2018 Farm Bill, producers could change elections in 2019 (for the 2019 and 2020 crop years), 2021, 2022, and 2023. However, producers still made elections based on their expectations of risks one year ahead, and payments were issued a year behind. For crop years 2019–2022, low commodity prices and poor growing conditions caused producer interest to shift from PLC to ARC for eligible crops (USDA-FSA, 2019, 2021).
Over the life of the 2014 Farm Bill, the split of farms electing to enroll in PLC versus ARC ranged widely according to crop base acres. For example, the percentage of county acres enrolled in ARC of the total enrolled acres from 2014 to 2018 changed from 62% to 6% for wheat base acres, 47% to 9% for grain sorghum base acres, and 84% to 61% for soybean base acres (USDA-FSA, 2019, 2021). Grain prices dropped considerably between 2014 to 2015, when the election was being made, and again during the 2016 to 2018 crop years. As a result, producers who elected PLC based on concerns around price risk benefited greatly from its price protections from 2016 to 2018. Low prices left many grain producers ready to change their election to PLC for the 2019 to 2020 crop years. For example, there were 63.57 million eligible wheat base acres in 2019, and 93% of those wheat base acres elected to enroll in PLC (USDA-FSA, 2019, 2021). Other grains exhibited similar movements in elections from ARC to PLC. An exception was soybeans, for which prices were high nationally. No PLC payments were triggered for soybeans over the 2014 Farm Bill term. Almost 80% of soybean base acres were enrolled in ARC for revenue protection should something happen to decrease yields under the expectation that soybean prices would remain strong in 2019 and 2020.
Another important option for managing risk is federally subsidized crop insurance, which began in the 1980s. The popularity of crop insurance increased rapidly as a risk management tool by the mid-1990s. Unlike ARC and PLC, crop insurance is tied to annual cropping decisions and management practices. As a result, more is known about market and weather conditions at the time of crop insurance purchase compared to ARC and PLC enrollment. Today, crop insurance has strong uptake in counties where it is offered. Revenue protection (RP) is most common for commodity crops like wheat and soybeans.
Agricultural production across the SGP is diverse, as are the approaches for managing risk in rainfed cropping areas. In the 2021 election period, 24.5 million base acres in the SGP were enrolled in either ARC or PLC. Wheat base acres were the most common, accounting for nearly half of all enrolled base acres, followed by seed cotton (21%), grain sorghum (13%), and corn (10%). High prices and adverse weather events caused some producers to shift from PLC to ARC in 2021 compared to 2019–2020. From 2019 to 2020, across the SGP, 95% of eligible base acres elected PLC coverage, but that dropped to 85% in the 2021 election period. Wheat base acres experienced a 7% decline in PLC enrollment in favor of ARC during the 2021 election period. Drought played an essential role in this shift, particularly given that the most significant shift away from PLC was for seed cotton in Texas, which exhibited a 31% decline from 2019 to 2020 to ARC coverage in 2021. Added flexibility allows producers and landowners to adjust to production and market conditions, and producers take advantage of those flexibilities.
Given the combination of production, safety-net, and crop insurance options rainfed wheat growers in the SGP face, which choices maximize producer profit? Which combinations balance risk and returns for a producer who prefers to avoid risk?
We evaluate the net returns from 16 wheat-fallow or wheat-summer crops, revenue protection, and PLC/ARC safety-net combinations using 20 years of yield data from each practice. Combinations include wheat, sorghum, or soybean base acres. The effects of program enrollment options—no enrollment, 75% coverage under Revenue Protection (RP) Insurance, ARC plus RP, or PLC plus RP—on the riskiness of net returns from wheat-fallow and wheat-summer crop rotations is analyzed in two ways. Although an ARC Individual option exists, only ARC County is evaluated throughout this paper.
The first method for measuring the riskiness of net returns from crop rotation/safety-net combinations uses the coefficient of variation (CV) statistic. The CV is the standard deviation of the net returns for a crop rotation/safety-net combination divided by its average, multiplied by 100. A standard deviation is a number that tells us how much variation there is around a crop rotation/safety-net combination’s average net returns. A lower CV indicates less variability in net returns. The CV is a relative measure, so it is comparable across crop rotation/safety-net combinations. We use the CV to rank the uncertainty around a combination’s net returns or yields. The CV approach only tells us how much variability there is in the net returns from a crop rotation/safety-net combination. A problem with this approach is that it cannot distinguish which combination a risk-averse farmer would prefer. Doing this requires a second method and some assumptions to explain why producers choosing to avoid risk choose one crop rotation/safety-net option over others.
The second approach is called stochastic dominance (SD) (Anderson, 1974). This method finds which crop rotation/safety-net combinations producers with preferred return distributions. For example, consider a crop rotation with constant returns of $20 per acre compared to a different crop rotation with returns of $21/acre and up. While the first crop rotation has a lower variance (equal to zero), all rational decision-makers prefer the second crop rotation.
This SD approach uses probability graphs of net returns for a crop rotation/safety-net combination to compare choices. The graph’s y-axis is probabilities, and the x-axis shows the net returns. Since we look at 20 years of data, a net return has a 1-in-20 chance of happening. Stochastic dominance makes two assumptions about how farmers make decisions when facing risk. The first rule assumes that a farmer will prefer the crop rotation/safety-net combination that generates the highest net return at all probabilities. When this happens, the choice is said to dominate others by the first degree (FDSD). Graphically, this means the distribution of net returns for a dominating challenger is always to the right of a competitor’s net return distribution. All farmers, risk-avoiding and otherwise, will always choose an FDSD crop rotation/safety-net option.
The second assumption, second-degree stochastic dominance (SDSD), implies that farmers will avoid choosing crop rotation/safety-net combinations with relatively low net returns. However, farmers will also seek a crop rotation/safety-net program combination whose net returns have upside variability. Farmers that avoid risk will always choose a crop rotation/safety-net combination that is SDSD over a challenger. Risk-avoiding producers choose this because SDSD rewards crop rotation/safety-net combinations with upside variability in net returns and penalizes competitors whose return distributions have downside variability. A crop rotation/safety-net combination with the lowest net return can never dominate another crop rotation. The first rule, FDSD, also implies the second rule, SDSD. It is easy to identify an FDSD crop rotation/safety-net combination because the winner’s net returns are always higher (graphically, further right) than the challengers at every net return outcome. Finding SDSD is more complicated but can be done using a spreadsheet (Hien et al., 1997). When a choice dominates the other, we say it is “preferred” according to the first or second rule.
Multi-year data from agronomic trials on rainfed wheat-fallow and wheat-summer crop rotations are limited. Instead, crop yields for each crop rotation were generated using the Agricultural Land Management Alternatives with Numerical Assessment Criteria (ALMANAC) software (Kiniry, 1992). Yields were simulated to reflect SGP growing conditions. Crop rotation yields were benchmarked to field experiments conducted by the USDA’s Agricultural Research Service in El Reno, Canadian County, Oklahoma. Crop yields were simulated for 20 periods.
Wheat-fallow and wheat-summer crop production schedules follow Decker et al. (2009). Seeding rates were 60 pounds per acre for wheat and 60,000 and 95,000 seeds per acre for grain sorghum and soybean, respectively (Lollato et al., 2017; Lofton et al., 2020; Lofton et al., 2021). Wheat was planted with a seed drill at a depth of 1.5 inches. Soybeans and sorghum were planted with a planter at a depth of 1.5 inches. Wheat was planted on November 10 and harvested on June 15 for all crop rotations. Soybean and grain sorghum was planted on July 10 and harvested on October 20. Tillage was set to a depth of 8 inches. We assumed tillage operations were 90% effective in removing weeds (Neve et al., 2003). Tillage operations were performed in August, September, and October, respectively (Epplin, 2007; Decker et al., 2009). Disking was performed prior to all planting for the summer-crop rotations.
Net returns for each crop rotation/safety-net combination were calculated using the simulated yields and Oklahoma State University Enterprise budgets for wheat, grain sorghum, and soybeans. Revenues were calculated in dollars per base acre as crop yield times the crop price for each of the 20 periods for the no-enrollment option. The no-enrollment option acts as the baseline to compare insurance and safety-net returns. The study focuses on outcomes from selecting the risk management choices of PLC and ARC. However, most producers purchase crop insurance for their operations. Hence, the simulation accounts for a revenue protection plan with an assumed 75% coverage level.
Revenue Protection (RP) was selected as the producer’s insurance option to cover planted acres because it guarantees a revenue target rather than only providing production loss protection. The RP plan began in 2011, so calculations for indemnity payments from 2011 to 2020 follow procedures outlined in Plastina et al. (2021). Premium amounts for 2011 to 2020 were calculated utilizing the USDA’s Risk Management Agency’s (RMA) Personalized Estimate Tool for 75% coverage RP insurance in Canadian County, Oklahoma (USDA-RMA, 2023b). A basic plan for a multi-cropping winter wheat farm was simulated using the tool each year, with no other policy options selected. From 2001 to 2010, the revenue protection insurance plan Crop Revenue Coverage (CRC) was used. Calculations for premium and indemnity amounts follow procedures from RMA’s High Risk Classification Premium Calculation Worksheet (USDA-RMA, 1998) and Stokes et al. (2008). To ensure yields used in the insurance policies were constant across crop rotation selections, non-irrigated wheat T-yields for 2001 to 2020 were used in RP and CRC calculations. Both CRC and RP indemnity calculations require projected (base) and harvest prices for winter wheat. Base and harvest prices for 2001–2020 for the analysis utilize the Kansas City Board of Trade’s historical prices. Insurance calculation yields and KCBOT prices used are sourced from RMA’s Commodity Report tool for wheat in Canadian County, Oklahoma (USDA-RMA, 2023a).
Revenues were adjusted when PLC or ARC payments were triggered using USDA’s Farm Service Agency (FSA) guidelines. The PLC payments, in dollars per acre, were calculated using the special 2020 update opportunity for PLC yield. The producer had the chance to either keep their existing PLC yield or update their yield. The update in 2020 benchmarks 90% of the producer’s 2013 to 2017 80% T-yield per planted acre to the quotient of the 2008 to 2012 national average yield divided by the 2013 to 2017 national average yield for the producer’s chosen commodity (USDA-FSA, 2019). The 2020 yield update was designed as a one-time option. The 2020 80% T-yield update was chosen such that yields are consistent across revenue states-of-nature for PLC yields. Therefore, yields used in the return calculations and the resulting payments are conservative. ARC payments for Canadian County (dollars per acre) were calculated as a rolling 5-year Olympic average from 2001 to 2020 following USDA-FSA (2021b) calculations.
Prices and costs were inflated to 2020 dollars using the Bureau of Labor Statistic’s (2020) deflator. Costs of fertilizer application, pesticide control, crop harvest, fallow, planting, and other cropping activities are from Oklahoma State University’s Enterprise 2020 Budgets for conventional tillage operations (Sahs, 2020a,b,c). Each activity’s required labor hours (per acre) was calculated using machinery and equipment usage requirements (Sestak, 1990). Labor costs for each activity were calculated as the labor hours required per acre per activity multiplied by OSU Enterprise Budget machinery wages per hour. Updates for tractor, seeder,disc, sprayer, combine, and other equipment standards relative to today’s machinery and equipment power and sizes for Oklahoma conventional tillage practices are from Sahs (2020a,b,c).
Expected wheat and soybean prices are from the USDA’s National Agricultural Statistics Service (USDA-NASS, 2021), 2001 to 2020. Expected grain sorghum prices for the Prairie Gateway region are from the USDA Economic Research Service (USDA-ERS, 2021). Calculations for PLC and ARC payments use the USDA Farm Service Agency (USDA-FSA, 2021b) methods, including ARC yields and national reference prices for program commodities. Drops in national average prices for covered commodities trigger ARC and PLC payments. Actual marketing year average prices received for the commodities are USDA-ERS (2021) prices received in dollars per bushel for grain sorghum and USDA-NASS (2022) prices received in dollars per bushel for wheat and soybeans.
Second, the customer should consider what happens when using other systems. Compatibility may be an issue and cause problems if a customer doesn’t verify that a piece of equipment or software are compatible with existing systems in terms of data transfer and use. It may require contacting a system manufacturer directly as some dealers or other middlemen may not be aware of software or hardware glitches or other issues.
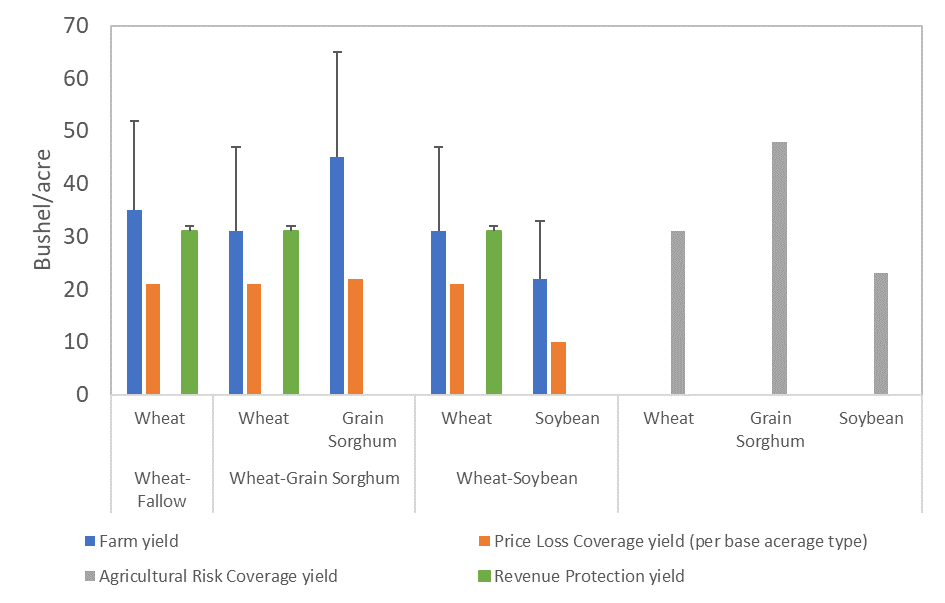
Farm, PLC, and ARC yields are reported in Figure 1. Farm yields for each crop and each crop rotation are more variable than ARC county-level crop yields, as indicated by the size of the bars over the yields. The bars are standard deviations of the yields. The bigger the standard deviation bar, the more variability around a yield. It is well-known that county average yields and returns are less variable than farm yields and returns. The PLC program uses each farm’s 80% T-yields for base yields, which are generally fixed. PLC yields per base acre do not vary for this reason. ARC revenue guarantee yields are tied to county yield averages. These averages are less variable than farm yields because they are calculated using the Olympic average of 5 years of yield data. The Olympic average drops the highest and lowest yield, reducing yield variability. Yield standard deviation bars for ARC yields in Figure 1 are small (standard deviations are 3, 8, and 4 bushels/acre for wheat, sorghum, and soybean, respectively).
Farm yields for wheat vary depending on the crop-rotation selections, so we assumed the producer is making RP enrollment decisions based on county T-yields, with 2001 being the first year of production. This assumption allows all three crop-rotation scenarios to use historical yield data from Canadian County for RP insurance decisions. These averages are less variable than farm yields because they are a simple average of county-level yields (Figure 1).
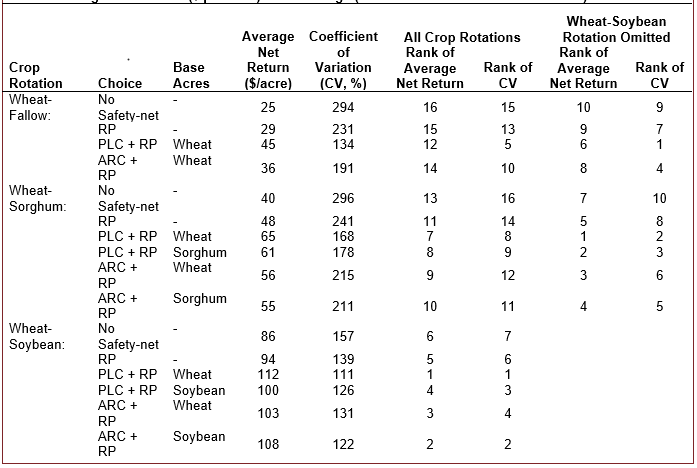
Net returns to each crop rotation are reported in Table 1. Among all crop rotation/safety-net combinations, a farmer enrolled in PLC plus RP and planted wheat followed by a soybean summer crop would realize the highest net returns ($112/acre) with greater certainty (the lowest coefficient of 111%). Unsurprisingly, wheat-fallow without a safety net had the lowest net returns ($25/acre) with more uncertainty (CV, 294%).
The PLC plus RP safety-net option generated the highest net return ($45/acre) with lower return variability (CV, 134%) for the wheat-fallow rotation. Among the wheat-sorghum planting alternatives and program safety-net options, net returns were highest when the farmer had wheat base acres ($65/acre). The CV was also the lowest for this crop rotation/safety-net option (168%). The wheat-soybean crop rotation net returns were higher than those from any other crop rotation/safety-net combination.
What if a producer was not equipped for a wheat-soybean rotation? Average net returns are highest for the wheat-sorghum cropping practice under PLC plus RP with wheat base acres (Table 1). This combination’s uncertainty around the net returns ranks second among the remaining alternatives. The wheat-fallow/PLC plus RP net returns varied the least (lowest CV) among the remaining crop rotation/safety-net combinations, but net returns ranked sixth. The reduction in uncertainty around wheat PLC plus RP yields relative to ARC plus RP, or no safety-net yields for wheat and sorghum, drives this result. Net returns from the wheat-sorghum rotation with sorghum base acres and PLC coverage rank second, but the uncertainty around the average ranks fifth.
Considering the wheat-fallow rotation with wheat base acres, risk-averse producers would enroll in ARC plus RP programs instead of choosing the “no safety-net enrollment” option by both FDSD and SDSD rules (Table 2). PLC dominates ARC by the SDSD rule. Only ARC County is evaluated here, so county average yield reductions often drive the ARC revenue-based payment trigger. County average yields vary less than individual farm yields because countywide extremes tend to average out. Further, the benchmark ARC yield is calculated on a 5-year-moving-average with the highest and lowest yields removed, so the benchmark yield tends to vary little. As a result, ARC payments are triggered less frequently. In Figure 2, returns under ARCplus RP are nearly indistinguishable from the “no safety net” returns.
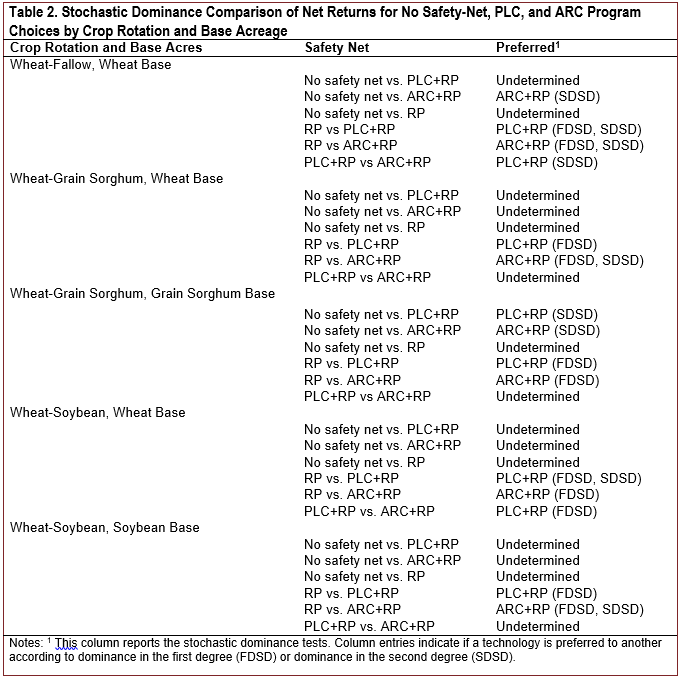 Notes: 1 This column reports the stochastic dominance tests.
Comparing safety-net options for a wheat-grain sorghum rotation with wheat base acres (Table 2), both the PLC and ARC plus RP safety-net options dominated the revenue protection insurance-only option by FDSD, meaning that both profit-maximizing and risk-averse producers prefer either program to revenue protection insurance alone. The lower net returns under PLC plus RP were always to the right of net returns from the “no safety-net enrollment” and ARC plus RP up to about the 55% probability of the distributions (Figure 2). This result again suggests that PLC always dominates either of the other two options when growing conditions are relatively poor and market prices are low. However, the higher range of net returns under PLC plus RP dominated the RP option, but it did not dominate ARC plus RP or the “no safety-net enrollment.” Recall that ARC payments are triggered less frequently because of the low variability in average county yields. Therefore, when a farm has low yields, there is no guarantee that other farms in the county will also experience low enough yields to trigger an ARC payment. Further, when prices are low, the variability of county-average yields stabilizes the distribution of county-level returns, reducing the likelihood of triggering an ARC payment.
The risk analysis results were similar to the wheat-fallow/wheat base acre results for the other comparisons. PLC and ARC safety-net options dominated the RP-only option by FDSD, and SD comparisons were inconclusive for the PLC and ARC comparisons. Both profit-maximizing and risk-avoiding producers prefer either program over no safety net. However, analyses did not demonstrate a dominant relationship between PLC and ARC. The PLC net return distributions are always to the right of the “no safety-net enrollment” and ARC net returns, up to about a 50% probability (Figure 2).
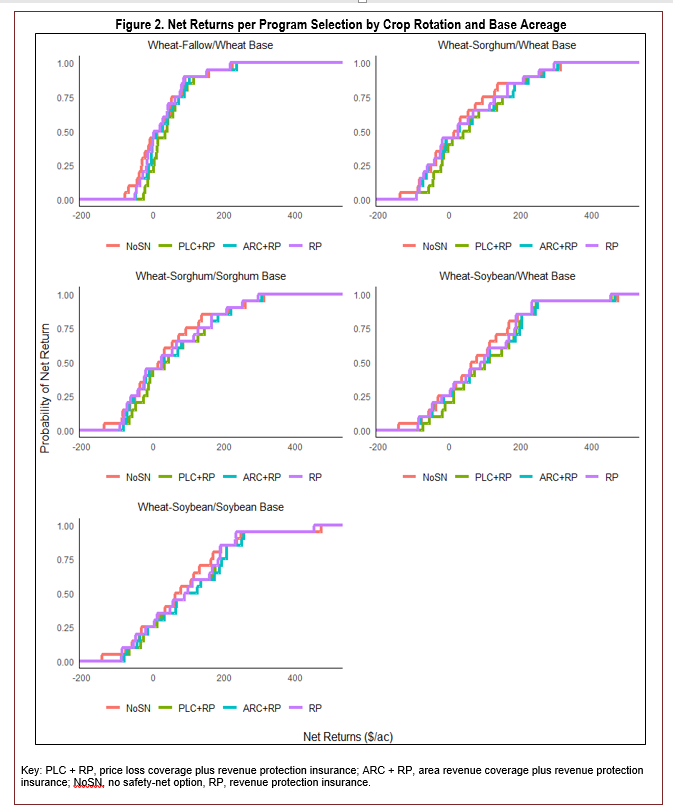
The SD results and graphical analysis of net returns suggest that a safety net is triggered under PLC enrollment during lower revenue conditions more frequently than under ARC. As revenue improves from moderate to good, it is unclear which option generates the highest net returns in any comparison. These findings are plausible because PLC responds to downward trends in commodity prices. PLC payments are triggered during poor market conditions. However, ARC payments might not be triggered because ARC uses county-average yields and the marketing year average (MYA) price to trigger payments. Stable county-average yields also tend to offset depressed MYA prices.
There are no differences in the riskiness of net returns for all crop rotations from the “no safety-net enrollment” option and ARC coverage and revenue protection insurance. Again, this is due to the stability of county-average yields used in ARC and RP calculations. ARC payments may not be triggered in a year if county average yields are good, even with low prices. Alternatively, if yields were low for a few years, the benchmark yield declines, making payment less likely. Therefore, ARC net returns track closely to the “no safety-net enrollment” and RP-only options. In addition, even if an ARC payment is triggered, payments are capped. While the differences in returns are minor, risk-averse and profit-maximizing producers prefer the ARC option to that of “no coverage.” In addition, for risk-averse wheat-grain sorghum growers with wheat base acres, PLC coverage is preferred over ARC. The upshot is that a large gap between prices and yields would need to occur for ARC to outperform PLC in most situations.
While “no safety-net enrollment” returns are only dominated by a program in three combinations (wheat-fallow/wheat base: ARC plus RP, wheat-grain sorghum/grain sorghum: PLC plus RP, and wheat-grain sorghum/grain sorghum: ARC plus RP), the “no safety-net” options have the largest coefficient of variation (widest range of returns) under their respective crop rotations. Since the returns of the “no safety-net enrollment” option vary greatly, most risk-averse producers will favor the insurance and safety net plus insurance programs. This ambiguity in preferences suggests that the added expense of paying for the revenue protection insurance reduces net returns compared to not enrolling in safety-net programs or not buying insurance. In the years when the safety-net and insurance programs trigger payment, the average returns per acre are higher. Variability in returns per acre for each crop rotation is lower than the “no safety-net enrollment” option (Table 1). Risk-avoiding producers prefer a reduction in variability and higher returns. Risk-avoiding producers and producers less worried about risk would not be too concerned about the ambiguity between the insurance plus program safety-net option compared to a “no safety-net enrollment” choice as long as the potential for high returns outweighs the potential for low returns.
ConclusionsRainfed wheat producers in the Southern Great Plains face yield and market loss risk. Producers can potentially increase returns to land by growing a summer cover crop instead of leaving the land fallow. However, summer-crop rotations do not necessarily ensure higher net returns because of the additional risks the producer takes on from planting a second crop.
The Agricultural Act of 2014 established Price Loss Coverage (PLC) and Agricultural Risk Coverage (ARC) programs to protect producers from price and revenue losses that may occur due to various factors, including market fluctuations, drought, hail, and trade disruptions. PLC is a commodity-specific program that provides financial assistance to producers when commodity prices fall below a reference price. ARC County provides financial assistance to producers when the actual county revenues from sales in a given year fall below the county’s target revenues. These safety-net options are designed to protect growers from unexpected revenue loss or lower commodity prices through different mechanisms. Both PLC and ARC provide financial assistance to producers through direct payments, which can help farmers cover their production costs and protect against financial losses.
In conclusion, safety-net programs like PLC and ARC and insurance coverage could motivate producers to change their usual cropping patterns and experiment with new crops, crop rotations, and crop rotations adapted to a region’s growing conditions. Planting summer crops could increase returns to land, but doing so carries additional risk. The key takeaways are that 1) summer cropping appears economically advisable; 2) PLC appears economically preferable to ARC when added to a revenue protection insurance plan; and 3) safety-net programs, which often have minimal impacts on the distribution of returns, improve returns, and lower risk. The findings suggest rainfed wheat producers should always sign up for either ARC or PLC. In contrast to insurance, it costs nothing, apart from time, to enroll in these safety-net programs that bring with them the potential for annual payments. If producers expect county yields to underperform in a given season relative to previous years, they should enroll in ARC. In this case, producers would need to track changes in county yields over multiple growing seasons closely.
Anderson, J. 1974. “Risk Efficiency in the Interpretation of Agricultural Production Research.” Review of Marketing and Agricultural Economics 42:131–184.
Babcock, B. 2014. “Welfare Effects of PLC, ARC, and SCO.” Choices 29(3).
Baumhardt, R. L., B. A. Stewart, and U. M. Sainju. 2015. “North American Soil Degradation: Processes, Practices, and Mitigating Strategies.” Sustainability 7: 2936–2960.
Brock, F.V., K.C. Crawford, R.L. Elliott, G.W. Cuperus, S.J. Stadler, H.L. Johnson, and M.D. Eilts. 1995. “The Oklahoma Mesonet: A Technical Overview.” Journal of Atmospheric and Oceanic Technology 12:5–19.
Collins, K., and H. Bulut. 2011. “Crop Insurance and the Future Farm Safety-Net.” Choices 26(4).
Decker, J.E., F.M. Epplin, D.L. Morley, and T.F. Peeper. 2009. “Economics of Five Wheat Production Systems with No-Till and Conventional Tillage.” Agronomy Journal 101:364–372.
Epplin, F.M. 2007. “Economics: No-Till versus Conventional Tillage.” In No-Till Cropping Systems in Oklahoma E-996. Stillwater, OK: Oklahoma Cooperative Extension Service, pp. 27–35. Available online: http://cotton.tamu.edu/Tillage/Overview%20of%20No-tillage%20Oklahoma.pdf
Ghimire, R., B. Ghimire, A.O. Mesbah, O.J. Idowu, M.K. O’Neill, S.V. Angadi, and M.K. Shukla. 2018. “Current Status, Opportunities, and Challenges of Cover Cropping for Sustainable Dryland Farming in the Southern Great Plains.” Journal of Crop Improvement 32(4): 579–598.
Hansen, N. C., B. L. Allen, R. Louis Baumhardt, and D. J. Lyon. 2012. “Research achievements and adoption of no-till, dryland cropping in the semi-arid U.S. Great Plains.” Field Crops Research 132:196–203.
Hardaker, J.B., G. Lien, J.R. Anderson, and R.B.M. Huirne. 2015. Coping with Risk in Agriculture: Applied Decision Analysis. Boston, MA: CABI.
Hien, V., D. lKaboréb, S. Youl, and J. Lowenberg-DeBoer. 1997. “Stochastic Dominance Analysis of On-Farm Trial Data:The Riskiness of Alternative Phosphate Sources in Burkina Faso, 1989-1991.” Agricultural Economics 15:213–221.
Kidane, S.M., D.M. Lambert, N.S. Eash, R.K. Roberts, and C. Thierfelder. 2019. “Conservation Agriculture and Maize Production Risk: The Case of Mozambique Smallholders.” Agronomy Journal 111(3):1–11.
Kiniry, J.R., J.R. Williams, P.W. Gassman, and P. Debacke. 1992. “A general, process-oriented model for two competing plant species.” Transactions of the ASAE 35(3):801–810.
Kumar, V., A.K. Obour, P. Jha, R. Liu, M. Manuchehri, J.D. Holman, and P.W. Stahlman. 2020. “Integrating Cover Crops for Weed Management in the Semi-Arid US Great Plains: Opportunities and Challenges.” Weed Science 68(4):311–323.
Lambert, D.M., and D. Lowenber-DeBoer. 2003. “Economic Analysis of Row Spacing for Corn and Soybean.” Agronomy Journal 95:564–573.
Lofton, J., A. Zander, K. Leonard, and C. Harris. 2020. Management Strategies for Double-Crop Soybean PSS-2197. Stillwater, OK: Oklahoma State University Extension.
Lofton, J., G. Strickland, C. Harris, A. Zander, N. Wyma, and S. Sharma. 2021. Grain Sorghum Performance Trials in Oklahoma. CR-2162. Stillwater, OK: Oklahoma State University Extension.
Lollato, R., D. Marburger, J.D. Holman, P. Tomlinson, D. Presley, and J.T. Edwards. 2017. Dual Purpose Wheat: Management for Forage and Grain Production. PSS-2178. Stillwater, OK: Oklahoma State University Extension.
Lowenberg-DeBoer, J., M. Krause, R.R. Deuson, and K.C. Reddy. 1990. A Simulation Model of Millet and Cowpea Intercrop. Bulletin 575. W. Lafayette, IN: Purdue University Agricultural Experiment Station.
Plastina, A., S. Johnson, and W. Edwards. 2021. Revenue Protection Crop Insurance. FM-1853. Ames, IA: Iowa State University Extension and Outreach.
Poland, T.M., T. Patel-Weynand, D.M. Finch, C. Ford Miniat, D.C. Hayes, and V.M. Lopez, eds. 2021. Invasive Species in Forests and Rangelands of the United States: A Comprehensive Science Synthesis for the United States Forest Sector. Heidelberg, Germany: Springer International Publishing.
McPherson, R.A., C. Fiebrich, K.C. Crawford, R.L. Elliott, J.R. Kilby, D.L. Grimsley, J.E. Martinez, J.B. Basara, B.G. Illston, D.A. Morris, K.A. Kloesel, S.J. Stadler, A.D. Melvin, A.J. Sutherland, and H. Shrivastava. 2007. “Statewide Monitoring of the Mesoscale Environment: A Technical Update on the Oklahoma Mesonet”. Journal of Atmospheric and Oceanic Technology 24:301–321.
Neter, J., M.H. Kutner, C.J. Nachtsheim, and W. Wasserman. 1996. Applied Linear Statistical Models. Chicago, IL: Irwin Press.
Neve, P., A.J. Diggle, F.P. Smith, and S.B. Powles. 2003. “Simulating Evolution of Glyphosate Resistance in Lolium rigidum II: Past, Present, and Future Glyphosate Use in Australian Cropping.” Weed Research 43:418–427.
Outlaw, J., and B. Fischer. 2023 , April 27. “Revisiting Planted versus Base Acres.” Southern Ag Today 3(17.4). Available online: https://southernagtoday.org/2023/04/27/revisiting-planted-versus-base-acres/ [Accessed May 30, 2023].
Richardson, C.W., and D.A. Wright. 1984. WGEN: A Model for Generating Daily Weather Variables. ARS-8. U.S. Department of Agriculture, Agricultural Research Service.
Sahs, R. 2020a. “2020 Oklahoma Grain Sorghum Budget.” OSU Agricultural Economics Enterprise Budgeting Software. Available online: http://agecon.okstate.edu/budgets/sample%20files/GrainSorghum2.1ltr.pdf [Accessed June 2020].
———. 2020b. “2020 Dryland Soybean Enterprise Budget.” OSU Agricultural Economics Enterprise Budgeting Software. Available online: http://agecon.okstate.edu/budgets/sample%20files/Soybeans2.1ltr.pdf [Accessed June 2020].
———. 2020c. “2020 Dryland Wheat Enterprise Budget- Grain and Graze.” OSU Agricultural Economics Enterprise Budgeting Software. Available online: http://agecon.okstate.edu/budgets/sample%20files/Wheat2.1ctc.pdf [Accessed June 2020].
Schnitkey, G., and C. Zulauf. 2016. “The Farm Safety Net for Field Crops.” Choices 31(4).
Sestak, R.E. 1990. A Decision Aid Tool for Selecting Farm Equipment and Estimating Costs of Machinery Complements. MS Thesis, Oklahoma State University.
Smirnov, N.V. 1939. “Estimate of Deviation Between Empirical Distribution Functions in Two Independent Samples.” Bulletin Moscow University 2:3–16.
Stokes, K., M. Waller, J. Outlaw, and G.A. Barnaby. 2008. Crop Revenue Coverage. E-477. Texas AgriLife Extension Service.
U.S. Bureau of Labor Statistics. 2020. “All Commodities Producer Price Index 1990 – 2019.” Available online: https://www.bls.gov/ppi/ [Accessed December 2020].
U.S. Department of Agriculture Economic Research Service. 2021. “Sorghum.” Commodity Costs and Returns. Available online: https://www.ers.usda.gov/data-products/commodity-costs-and-returns/ [Accessed April 2021].
U.S. Department of Agriculture Farm Service Agency. 2019. “Enrolled Base Acres by County by Commodity by Program." ARC/PLC Program Data. Available online: https://www.fsa.usda.gov/programs-and-services/arcplc_program/arcplc-program-data/index [Accessed March 2022].
———. 2021a. ARC/PLC Program Data. Available online: https://www.fsa.usda.gov/programs-and-services/arcplc_program/arcplc-program-data/index [Accessed April 2021].
———. 2021b. “Enrolled Base Acres by County by Commodity by Program.” ARC/PLC Program Data. Available online: https://www.fsa.usda.gov/programs-and-services/arcplc_program/arcplc-program-data/index [Accessed March 2022].
U.S. Department of Agriculture National Agricultural Statistics Service. 2021. “Oklahoma Marketing Year Average Price Wheat and Soybeans 1990 – 2020.” QuickStats. Available online: https://quickstats.nass.usda.gov/results/70ABFED9-5D42-3543-9660-506A4021AF35 [Accessed March 2021].
———. 2022. “National Marketing Year Average Price Wheat and Soybeans 1990 – 2020.” QuickStats. Available online: https://quickstats.nass.usda.gov/results/703F485B-1861-389D-9765-03EB5D415DC2 [Accessed March 2022].
U.S. Department of Agriculture Natural Resources Conservation Service (NRCS), Soil Survey Staff. “Canadian County, Oklahoma.” Soil Survey Geographic (SSURGO) Database. Available online: https://www.nrcs.usda.gov/resources/data-and-reports/soil-survey-geographic-database-ssurgo [Accessed February 2021].
U.S. Department of Agriculture Risk Management Agency. 1998. “Crop Revenue Coverage – High Risk Classification Premium Calculation Worksheet.” Available online: https://www.rma.usda.gov/ftp/policies/1999/crc/prem_calc/pdf/99PREMHR.pdf [Accessed May 2023].
———. 2022. “Supplemental Coverage Option for Federal Crop Insurance.” Risk Management Agency Fact Sheet. Available online https://www.rma.usda.gov/en/Fact-Sheets/National-Fact-Sheets/Supplemental-Coverage-Option-2022 [Accessed April 2023].
———. 2023a. “Commodity Report Tool.” Available online: https://webapp.rma.usda.gov/apps/actuarialinformationbrowser/DisplayCrop.aspx. [Accessed May 2023].
———. 2023b. “Personalized Estimate Tool.” Available online: https://ewebapp.rma.usda.gov/apps/costestimator/Estimates/DetailedEstimate.aspx [Accessed May 2023].
U.S. Geographical Service [USGS]. 2016. “Groundwater Depletion: United States Geological Survey.” Available online: https://www.usgs.gov/special-topics/water-science-school/science/groundwater-decline-and-depletion.

