The second quarter 2018 issue of Choices focused on the current trade war between the United States and China. The authors of this theme explained the state of the conflict at the time of publication (May 2018) and detailed some of the likely impacts of Chinese tariffs on U.S. agricultural exports levied in response to U.S. tariffs on Chinese exports to the United States. Zheng et al. (2018); Taheripour and Tyner (2018); Hansen et al. (2018); Liu, Robinson, and Shurley (2018); and Countryman and Muhammad (2018) predicted dramatic effects for U.S. production and trade of commodities such as soybeans, corn, sorghum, and other food and feed grains; cotton; and wine. The first exchange of tariffs between the United States and China occurred in early 2018 and was followed by a second round in April (Marchant and Wang, 2018).
The Trump administration subsequently initiated procedures to levy additional tariffs on $200 billion worth of Chinese exports to the United States, and China has indicated that it would levy retaliatory tariffs on $60 billion of U.S. exports to China (Bradsher, 2018). According to Bradsher, Chinese imports from the United States are so much smaller than U.S. imports from China that the Chinese government is unable to match the magnitude of the U.S. tariffs in its efforts to retaliate.
In 2017, the United States imported goods and services worth about $523 billion ($505.4 billion in goods and $17.4 billion in services) from China. In the same year, China imported slightly more than $187 billion worth of goods and services ($129.8 billion in goods and $57.6 billion in services) from the United States (U.S. Census Bureau, 2018).
The trade war is still evolving, but an important new element has been added to the mix. Recognizing the adverse effects Chinese tariffs are likely to have on U.S. farmers, the Trump Administration is offering up to $12 billion in compensation to producers for losses resulting from the Chinese retaliatory tariffs. On August 27, 2018, the Secretary of Agriculture released a description of the main elements of this program along with compensation rates for various commodities (USDA, 2018c). This article assesses the likely impacts of this program for soybeans, sorghum, and corn producers in the U.S. Midwest and Plains states. The 14 states in this analysis account for 90% of total expected U.S. corn production and 87% of total expected U.S. soybean production in 2018 (see Table 1). Seven states in this region account for 88.6% of U.S. sorghum production (USDA, 2018b).
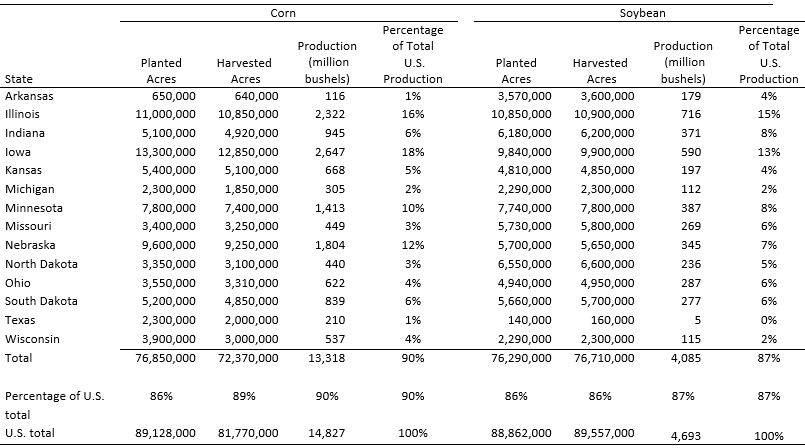
Source: U.S. Department of Agriculture (2018b).
Three programs have been set up to compensate farmers for losses due to China’s retaliatory tariffs. The most important is the Market Facilitation Program (MFP), for which about $4.7 billion have been set aside for the first round of payments. After September 4, 2018, producers who had completed their harvests became eligible for initial payments based on the published payment rates applied to half their reported production (USDA, 2018c). The initial payment rate for soybeans, for example, is $1.65/bushel, compared with $0.86/bushel for sorghum and only $0.01/bushel for corn. The differences in these payment rates presumably reflect the significance of the Chinese market for particular U.S. commodity exports and the magnitude of the negative impact on prices as a result of the retaliatory tariffs. Chinese corn imports from the United States made up only about 1.6% of total U.S. corn exports in 2017, although the proportion was slightly higher for distillers dried grains at 3.4% (USDA, 2018a). According to Zheng et al. (2018), on the other hand, about half of U.S. soybean production is exported, and about 57% of U.S. soybean and soybean product exports in 2017 were destined for the Chinese market. Similarly, Zheng et al. report that 56% of 2017 U.S. sorghum production was exported, and China purchased 81% of these exports. USDA’s initial estimates of the amounts likely to be distributed to producers of the covered commodities suggest that 77% of payments will go to soybean producers, with 2% and about 3% going to corn and sorghum producers, respectively (USDA, 2018c).
To be eligible for MFP payments, farmers must be in compliance with conservation requirements and the average annual adjusted gross income from the farm enterprise between 2014 and 2016 must be less than $900,000. In addition, the MFP payments cannot exceed $125,000 per producer or legal entity (USDA, 2018c). This cap would come into effect for a soybean producer with eligible output of about 151,515 bushels, or 2,525 harvested acres at an average yield of 60 bushels/acre. USDA officials will determine whether a second MFP payment is to be made at a later date. In addition to the MFP program, about $1.2 billion will be used to purchase a wide range of consumer products that will be distributed to food banks and other nutrition assistance programs. Good (2018) reported that these nutrition assistance purchases will increase the amount normally distributed for such programs by about 50%. Finally, $200,000 is to be made available for promotional programs operated by the Foreign Agriculture Service (FAS) on a cost-share basis with eligible advertising and promotional organizations (USDA, 2018c).
Calculating the size of producer payments under the MFP program is a simple matter of multiplying the published payment rates by half of a producer’s harvested output. Whether these payments will fully compensate for the revenue losses caused by Chinese tariffs is more complicated because it is difficult to identify an appropriate counterfactual price. Commodity prices were expected to be lower in 2018 as a result of abundant harvests, so the effects of the tariff are likely to be confounded with the normal market response to increases in output. Good (2018) reported estimates of revenue losses linked to the tariffs of $2 billion for pork producers and $6–$7 billion for soybean producers. Losses of this magnitude would be much greater than the anticipated MFP payments of $290.3 million for pork and $3.63 billion for soybeans (USDA, 2018c). Many producers believe that the MFP payments will not cover the losses caused by the tariffs (Newman, 2018). Using economic models to isolate the effects of the Chinese tariff on producer prices in the United States, Zheng et al. (2018) estimated losses in producer surplus ranging from $68 million for cotton producers to $1.8 billion for soybean producers. Taheripour and Tyner (2018) found that the Chinese tariffs on soybeans and products will lead to total losses in economic welfare (producer and consumer surplus) of about $2.6 billion for the United States, with substantial increases in economic well-being in Brazil and other South American countries that compete with U.S. exporters on world and Chinese markets. They estimated the net effect of the Chinese soybean tariffs for the world as a whole as a loss in economic welfare of about $1.5 billion. The overall loss results from welfare losses in the United States and China that are greater than the gains in Brazil and other exporters.
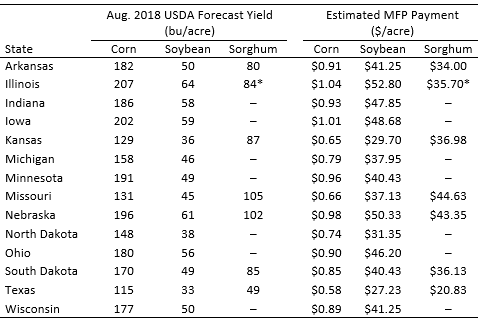
Notes: Single asterisk (*) indicates data from 2017.
Source: U.S. Department of Agriculture (2018b) and authors’ estimates.
To translate these effects to the level of individual producers, we calculate the payments that would be made to a producer with average predicted crop yields in the 14 U.S. states in the Plains and Midwest that are the source of most U.S. corn, sorghum, and soybean production. The expected effective payments per acre based on the announced payment and forecast yield from USDA (2018b) are shown in Table 2. They are calculated as:
Estimated MFP Payment per Acre = USDA Rate x 50 x Expected Yield
These payments range from $27.23 to $52.80 per acre of soybeans. Illinois soybean producers can expect to get the largest payment on a per acre basis because their expected yield is the highest compared with that of the other states. For corn producers, payments are from $1.04 (Illinois) to $0.58 (Texas) per acre, while sorghum payments range from $20.83 (Texas) to $44.63 (Missouri) per acre.
An interesting question related to the MFP program is whether the payments will compensate farmers for the lost revenue resulting from price declines caused by the U.S.–China trade war. Answering this question is complicated because it is difficult to know what corn, sorghum, and soybean prices would have been if there had been no Chinese tariff. Because of favorable conditions, the 2018 corn and soybean harvests are expected to be record-breakers (Barrett, 2018). The increased output would almost certainly have resulted in lower prices than in 2017, even if there had been no Chinese tariffs. For example, the September 5, 2017, open futures price for soybeans was $9.53/bushel, much higher than the September 4, 2018, open price of $8.46 (Chicago Mercantile Exchange, 2018). Part of this price decline may have been due to the anticipated impacts of the Chinese tariff, but it is likely that much of the decline was a normal price response to the increase in output. Based on their simulation model, Zheng et al. (2018) found that the Chinese tariff would lead to a fall in soybean prices of 3.9%. Taheripour and Tyner (2018b) estimated that a 10% Chinese tariff would lead to declines in soybean prices of 1.95%–3.21%, while a 30% tariff would cause prices to fall by 4.35%–5.95%. These results suggest that the actual Chinese tariff of 25% would mean that the September 4, 2018, soybean price might have been about 4% lower than would have been the case without the tariff. In other words, based on these results, the September 4, 2018, open price ($8.46/bushel) would have been $8.80 if there had been no Chinese tariff.
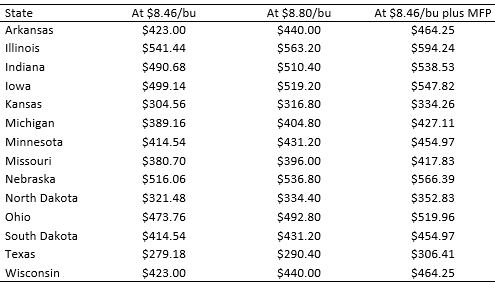
Source: Authors’ calculations.
Notes: Single asterisk (*) indicates data from 2017.
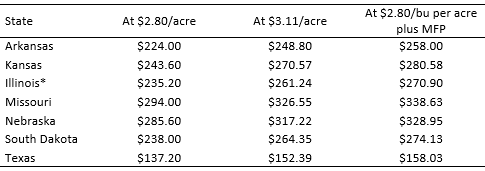
Source: Authors’ calculations.
Table 3 reports revenue estimates based on soybean prices of $8.46/bushel and $8.80/bushel in the 14 Plains and Midwest states as well as estimated revenue at the tariff-distorted 2018 price with the predicted MFP based on the August yield predictions (USDA, 2018b). It is clear from these results that the MFP payments more than compensate for the tariff-induced losses. This is also evident from the fact that when the effective payment rate of $0.825 is added to the September open price, the result is an effective price of $9.285, which is 9.75% higher than the market price. This suggests that the MFP for soybean producers more than compensates for the estimated 4% price decline due to the tariff.
Based on their simulation model, Zheng et al. (2018) found that the Chinese tariff would lead to a fall in sorghum prices of 10.6%. The USDA (2018c) predicts a price range for 2018/19 sorghum of $2.80–$3.80 per bushel. Using the lower-bound estimate, we completed a similar analysis for the seven states that produce significant amounts of sorghum (Table 4). Assuming that these price estimates are about 11% below the price that would have prevailed in the absence of the Chinese tariffs, the counterfactual price would be $3.11. As in the case of soybeans, the estimated MFP payment more than compensates for the predicted price decline resulting from the Chinese tariff. At the upper estimate ($3.80), the MFP payment would either just barely compensate for the 11% price decline or fall short of full compensation.
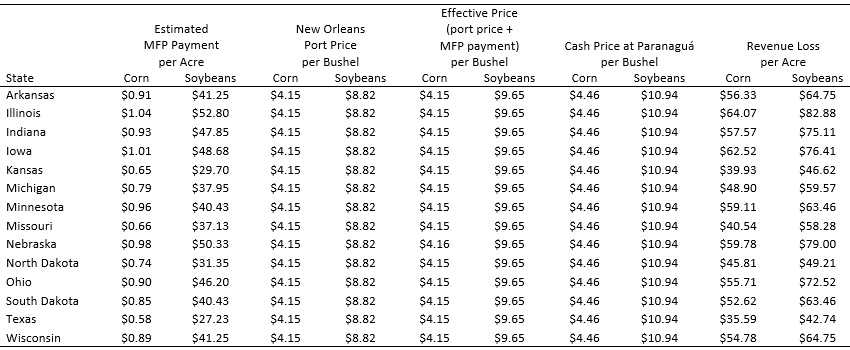
Another way to analyze the effects of the Chinese tariff is to compare FOB export prices at the main ports in other soybean producing countries with the FOB New Orleans price. For this study, we compared the FOB price in Paranaguá, Brazil, with the New Orleans price (CEPEA, 2018; USDA, 2018d). Prices for New Orleans were for October 15, 2018, and prices for Paranaguá were for October 11, 2018. Because the price of U.S. soybeans in China is increased by the tariff, Chinese importers are likely to shift from U.S. soybeans to suppliers in Brazil and other South American countries. Increased demand for Brazilian soybeans should lead to higher prices there, while depressed demand for U.S. soybeans should lead to lower prices domestically. The difference between export prices in Brazil and in the United States is an upper-bound estimate of the tariff’s impact. Table 5 reports revenue calculations based on comparing these export prices. In this case, the revenue shortfall is much greater because the effects on both U.S. and Brazilian prices are taken into account. This supports the results of Taheripour and Tyner (2018), who showed welfare gains in Brazil and other South American countries as a result of the Chinese tariff. The figures in Table 5 are calculated as follows:
Revenue Loss per Acre = TRmfp – TRp
TRmfp = (New Orleans Price + MFP per bushel) x Expected Yield
TRp = Paranagua Price x Expected Yield
Source: Authors’ calculations.
In response to U.S. tariffs on Chinese imports, the Chinese government has retaliated with tariffs on U.S. exports to China, including agricultural exports of commodities such as soybeans, corn, and sorghum. For sorghum and soybeans, in particular, the effects of these tariffs may be significant because China is an important export destination for these goods, a large share of U.S. production is exported, and alternative outlets are limited by competition from other exporting countries. Given the likely negative impacts on producer prices in the United States, the Trump administration has set up three programs aimed at compensating farmers for losses incurred as a result of the tariffs. The most important of these programs is the Market Facilitation Program, which provides for direct payments to producers based on a set of payment rates applied to half of their 2018 harvest. In this study, we have calculated the average per acre payments based on projected yields in the 14 Midwest and Plains states that produce the majority of U.S. soybeans, sorghum, and corn. Using estimates of the effects of the Chinese tariffs on U.S. prices, we compare the expected per acre revenue with and without the MFP payments. In addition, we compared FOB export prices from Paranaguá, Brazil, and New Orleans to measure the magnitude of the price disparity as U.S. export prices decline and those from Brazil increase in response to a rise in demand from China.
Based on the results reported above, it appears that corn, sorghum, and soybean producers who meet all the requirements for receiving MFP payments will be more than compensated for any losses caused by the Chinese tariffs. The actual per acre revenue will differ for each producer based on actual yield, marketing strategies pursued, and many other factors. Very large producers with output sufficient to trigger the $125,000 payment cap will receive lower per acre payments than similar producers not subject to the cap, but their compensation will still more than offset the hypothetical losses from the Chinese tariff. These results suggest that there may not be a need for a second round of MFP payments. On the other hand, the MFP targets only short-term losses resulting from the implementation of the Chinese trade barriers during the current marketing year. The trade war may cause permanent damage to trade relations that will only become manifest in coming years, and it is unlikely that there will be further compensation for these negative future impacts. The difference in export prices for U.S. and Brazilian soybean exports reported in Table 5 shows that U.S. trade policies can have indirect effects on third-party markets as other countries adjust to the shifting trade patterns induced by the trade war. Given that abundant harvests in the United States would have resulted in lower prices in any case, the additional price effects of the Chinese tariff were unsettling and, although the assistance package offered by the USDA seems to offer significant compensation, most farmers would probably have preferred to sell their commodities at market prices not distorted by trade barriers.
Agfax. 2018. Gulf Port Grain. Available online: https://agfax.com/agriculture-latest-news/markets/gulfport-grain/
Barrett, J. 2018. “USDA Forecasts Record High Corn Yield and Soybean Production for 2018.” Washington, DC: U.S. Department of Agriculture, Economic Research Service. Available online: https://www.nass.usda.gov/Newsroom/2018/08-10-2018.php
Bradsher, K. 2018, September 19. “China Runs Short of Ammunition in Trade War.” New York Times, p. 1.
CEPEA. 2018. ESALQ/BM&FBOVESPA Soybean Cash Price Index - Paranaguá (PR). Piracicabo, Brazil: University of São Paolo, Luiz de Queiroz College of Agriculture (ESALQ), Department of Economy, Administration and Sociology, Center for Advanced Studies on Applied Economics (CEPEA). Available online: https://www.cepea.esalq.usp.br/en/indicator/soybean.aspx
Countryman, A.M., and A. Muhammad. 2018. “Chinese Trade Retaliation May Diminish U.S. Wine Export Potential.” Choices 33(2).
Chicago Mercantile Exchange. 2018. Soybean Future Quotes, Historical Data. Available online: https://www.cmegroup.com/trading/agricultural/grain-and-oilseed/soybean.html [Accessed Sept. 4, 2018].
Good, K. 2018. “USDA’s Trade Aid Package.” Farm Policy News, University of Illinois. Available online: https://farmpolicynews.illinois.edu/2018/09/usdas-trade-aid-package/
Hansen, J., M.A. Marchant, W. Zhang, and J. Grant. 2018. “Upheaval in China’s Imports of U.S. Sorghum.” Choices 33(2).
Liu, Y., J.R.C. Robinson, and W.D. Shurley. 2018. “China’s Potential Cotton Tariffs and U.S. Cotton Exports.” Choices 33(2).
Marchant, M.A., and H.H. Wang. 2018. “Theme Overview: U.S.–China Trade Dispute and Potential Impacts on Agriculture.” Choices 33(2).
Newman, J. 2018. “Farmers Say Aid Package Won’t Cover Tariff Damage.” Wall Street Journal.
Taheripour, F., and W.E. Tyner. 2018. “Impacts of Possible Chinese 25% Tariff on U.S. Soybeans and Other Agricultural Commodities.” Choices 33(2).
Taheripour, Farzad, and Wallace E. Tyner. 2018. "Impacts of Possible Chinese Protection on US Soybeans." Department of Agricultural Economics, Purdue University. Available at: https://www.gtap.agecon.purdue.edu/resources/download/9074.pdf [Accessed October 25, 2018]
U.S. Census Bureau. 2018. Foreign Trade. Available online: https://www.census.gov/foreign-trade/statistics/historical/index.html [Accessed Sept. 14, 2018]
U.S. Department of Agriculture. 2018a. Global Agricultural Trade Statistics (GATS) Database. Washington, DC: U.S. Department of Agriculture, Foreign Agriculture Service. Available online: https://apps.fas.usda.gov/gats/ExpressQuery1.aspx [Accessed Sept. 18, 2018]
U.S. Department of Agriculture. 2018b. Quick Stats, Washington, DC: U.S. Department of Agriculture, National Agricultural Statistics Survey. Available online: https://quickstats.nass.usda.gov/ [Accessed Sept. 30, 2018]
U.S. Department of Agriculture. 2018c. “USDA Announces Details of Assistance for Farmers Impacted by Unjustified Retaliation.” Washington, DC: U.S. Department of Agriculture Press Release No. 0167.18. Available online: https://www.usda.gov/media/press-releases/2018/08/27/usda-announces-details-assistance-farmers-impacted-unjustified
U.S. Department of Agriculture. 2018. “World Agricultural Supply and Demand Estimates.” U.S. Department of Agriculture, Agricultural Marketing Service, WASDE 582. Available online: https://www.usda.gov/oce/commodity/wasde/latest.pdf
Zheng, Y., D. Wood, H.H. Wang, and J.P.H. Jones. 2018. “Predicting Potential Impacts of China’s Retaliatory Tariffs on the U.S. Farm Sector.” Choices 33(2).

