The U.S. Department of Agriculture (USDA) recently reviewed trends in cover crop and conservation tillage adoption in the United States. Cover crop adoption increased by 50% (or 5.1 million acres) between 2012 and 2017, while showing substantial variability across the 50 states (Wallander et al., 2021). The use of conservation tillage, including no-till, followed varying patterns through time and across main cash crops (Claassen et al., 2018): An initial period of substantial growth in conservation tillage and no-till wheat (2004–2009) and soybeans (2002–2006) was followed by less rapid gains for wheat (2009–2017) and decline in conservation tillage and no-till soybeans (2006–2012); growth in conservation tillage and no-till use was modest in corn and cotton.
The main metric used by the USDA to evaluate progress in adoption of conservation practices is the net change in acreage devoted to each practice between two points in time. We argue that while such a metric is satisfactory to measure overall progress, it hides valuable information on gross adoption and disadoption of conservation practices that would be discernible at less aggregated levels. In particular, disadoption of conservation practices might not only limit the immediate potential of soil health systems to benefit farmers and society (Stevens, 2019) but also rapidly erase accumulated benefits from years of regenerative practices. For example, one tillage pass to mitigate weed pressure can release back to the atmosphere the carbon sequestered into the soil over multiple years of sustained no-till (Wade and Claassen, 2017). Sustained adoption of regenerative practices is a prerequisite for the development of stable voluntary environmental credit markets as proposed by the U.S. Growing Climate Solutions Acts of 2020 and 2021.
Understanding the dynamics of gross adoption and disadoption of conservation practices is not only critical to evaluate the feasibility of voluntary markets for carbon and ecosystem services but also to inform policymakers on the relative merits of adoption-promoting versus disadoption-abating conservation programs in the United States. For example, the state of Maryland has been promoting cover crops since 2009 through a cost-share program with annual outlays of about $22.5 million and experienced a 6% net increase in cover-cropped area between 2012 and 2017 (Wallander et al., 2021). However, cover crop area declined in 6 out of the 23 Maryland counties (26.1%), by a total of 14,790 acres over the same period (USDA, 2014, 2019). If such disadoption had been avoided, the net increase in cover crop area in Maryland would have amounted to 97,685 acres instead of 83,160 acres (17% higher).
In this article, we summarize regional trends of adoption and disadoption of cover crops and no-till in the United States by Farm Resource Region (USDA, 2000). Each region is composed of clusters of counties characterized by the production of a few commodities, and its borders cut across state boundaries (Figure A1 in Appendix). We also introduce an indicator to evaluate the efficiency with which conservation practices expand within regions while accounting for disadoption. Our hope is to raise key issues and motivate future research that will inform the design of policies to foster sustained adoption of regenerative practices in agriculture.
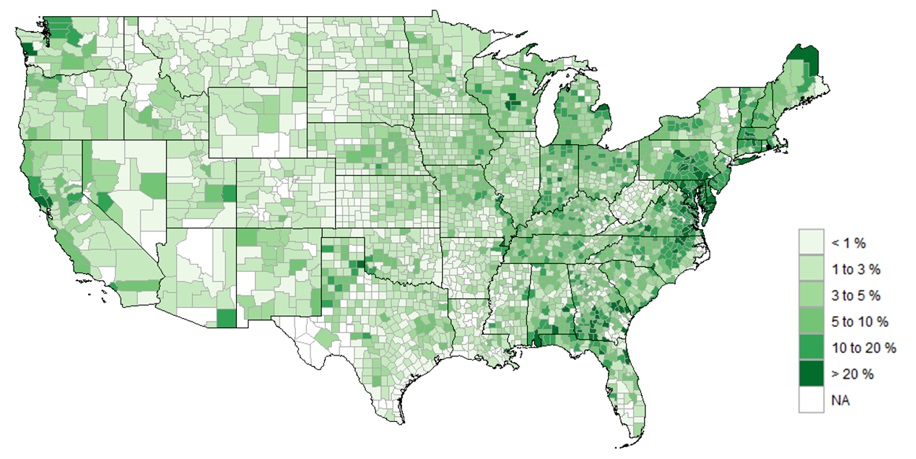
Panel A. Cover Crop Adoption Rate by County, 2017
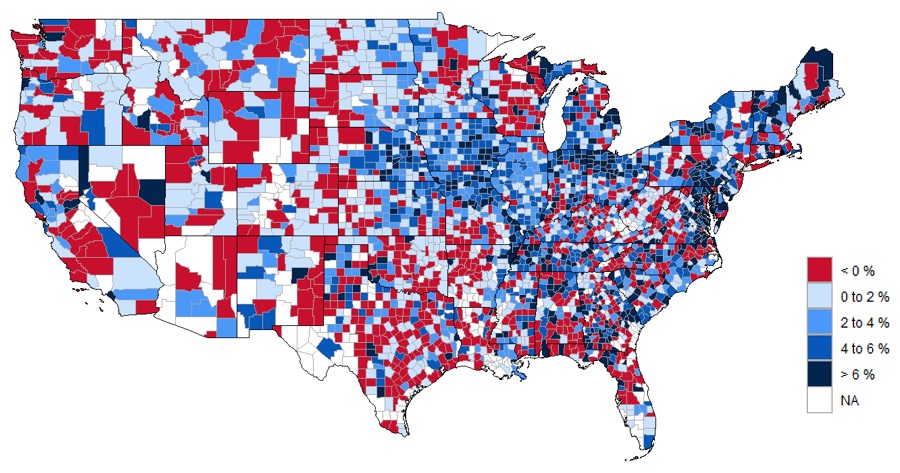
Panel B. Percentage-Point Change in Cover Crop Adoption
Rate by County, 2017 vs. 2012
Source: Authors' calculations based on Census of Agriculture
(USDA 2014, 2019).
Cover crops were planted on 3.88% of total cropland acres across the 48 contiguous states of the United States in 2017, up from 2.64% in 2012 (Table 1). Figure 1 illustrates the rate of adoption of cover crops by county in 2017 (Panel A) and the percentage-point change in the adoption rate from 2012 to 2017 (Panel B). To gain a better understanding of adoption trends, we break down results into the nine Farm Resource Regions (USDA, 2000). The Heartland region largely coincides with the Corn Belt and is characterized by cash grains and cattle farms; it produces more than two-thirds of all U.S. corn. The Northern Crescent is mainly composed of dairy, general crop, and cash grain farms, and produces about one-tenth of the corn crop. The Northern Great Plains are characterized by wheat, cattle, and sheep farms. Cattle, wheat, sorghum, cotton, and rice farms are typical in the Prairie Gateway region, and corn production amounts to about 15% of the national corn crop (Foreman, 2001). The Eastern Uplands region counts the most small farms of any region, producing cattle on part-time, tobacco, and poultry. Part-time cattle, general field crop, and poultry farms characterize production in the Southern Seaboard. The Fruitful Rim is characterized by fruit, vegetable, nursery, and cotton farms. The Basin and Range region has the smallest share of cropland and is dominated by cattle, wheat, and sorghum farms. Last, cotton, rice, poultry, and hog farms predominate in the Mississippi Portal.
The Farm Resource Region with the highest adoption rate in 2017 was the Southern Seaboard (11.08%), followed by the Northern Crescent (7.4%) and the Eastern Uplands (4.66%). However, the largest adoption gain between 2012 and 2017 occurred in the Heartland, where 2.36 million additional acres were planted to cover crops, equivalent to 47% of the national net change in cover-cropped area.
Disadoption played an important role in limiting the net expansion of cover crop area at the national level: 863 counties, or 28.26% of all counties in the contiguous U.S. states, disadopted a total of 930,506 acres (Table 1). In the absence of disadoption, the net expansion of cover crop area would have been 18.5% higher, or 6 million acres. Given prior findings that persistent adoption of cover crops is lagging in corn–soybean systems, with a large proportion of cover-cropped acreage only using the practice one or two years out of a four-year period (Wallander et al., 2021), it is possible that some of the observed disadoption reflects non-continuous use of these practices, or “alternating adoption” (Pannell and Claassen 2020). Not only is this finding relevant in terms of the societal benefits from healthier soil systems that were not accrued, but also if the pattern of disadoption can be extrapolated into the future, it can have serious negative implications for the credibility and stability of voluntary markets for carbon and ecosystem services.
To inform policymakers about the relative efficiency with which each region adds conservation practices through time using publicly available data, Table 1 reports disadoption ratios for all regions. The disadoption ratio is calculated as the total decline in cover-cropped area across counties that experienced net disadoption divided by the total increase in cover-cropped area across counties that experienced net adoption in a region. The disadoption ratio is negatively related to the efficiency with which a region expands its area under a conservation practice and can be indicative of the probability of seeing the conservation practice discontinued over a five-year period. The disadoption ratio across all regions amounted to 15.60, suggesting that for every 100 additional acres in cover crops across counties that experienced expansion in cover crops, counties that experienced disadoption lost 15.60 acres, resulting in a net increase in cover crop area of 84.40 acres. The region with the lowest cover crop disadoption ratio was the Heartland (4.63%), followed by the Mississippi Portal (7.58%) and the Northern Crescent (12.75). The region with the highest disadoption ratio was the Fruitful Rim (72.74%), followed by Basin and Range (56.28%) and Prairie Gateway (30.03%). Despite being the region with the highest cover crop adoption rate, the Southern Seaboard ranks fifth out of nine regions in terms of efficiency. Table A1 in the Appendix reports the cover crop adoption rate and disadoption ratio by state.
| Cover Crop Adoption Ratea (%) |
Disadoption of Cover Crops 2012–2017 |
Region Totals 2012–2017 |
||||||
| Region | 2012 | 2017 | No. of Counties |
Percentageb of Counties |
Change in Acres |
Net Change in Acres |
Disadoption Ratio (%) |
Efficiency Rankingc |
| Heartland | 2.12 | 4.19 | 68 | 12.52 | -114,509 | 2,357,763 | 4.63 | 1 |
| Northern Crescent | 5.91 | 7.84 | 107 | 25.78 | -103,764 | 710,051 | 12.75 | 3 |
| Northern Great Plains | 0.93 | 1.47 | 50 | 27.93 | -72,917 | 371,206 | 16.42 | 4 |
| Prairie Gateway | 2.03 | 2.69 | 146 | 37.06 | -260,409 | 606,881 | 30.03 | 7 |
| Eastern Uplands | 3.84 | 4.66 | 148 | 36.27 | -56,813 | 156,797 | 26.60 | 6 |
| Southern Seaboard | 8.76 | 11.08 | 151 | 31.59 | -129.539 | 460,447 | 21.96 | 5 |
| Fruitful Rim | 2.80 | 3.01 | 104 | 37.55 | -126,204 | 47,232 | 72.74 | 9 |
| Basin and Range | 1.36 | 1.58 | 53 | 27.18 | -42,693 | 33,170 | 56.28 | 8 |
| Mississippi Portal | 1.70 | 3.50 | 36 | 21.82 | -23,838 | 290,846 | 7.58 | 2 |
| U.S. Total | 2.64 | 3.88 | 863 | 28.26 | -930,506 | 5,034,393 | 15.60 | |
a Adoption rate calculated as cover crop area divided by total cropland area. Total cropland includes cropland harvested, crop failure, cultivated summer fallow, cropland used only for pasture, and idle cropland.
b Percent of counties calculated with respect to all counties in the state (including counties with missing data).
c Efficiency ranking with respect to disadoption ratio.
Source: Authors’ calculations based on Census of Agriculture (USDA 2014, 2019).
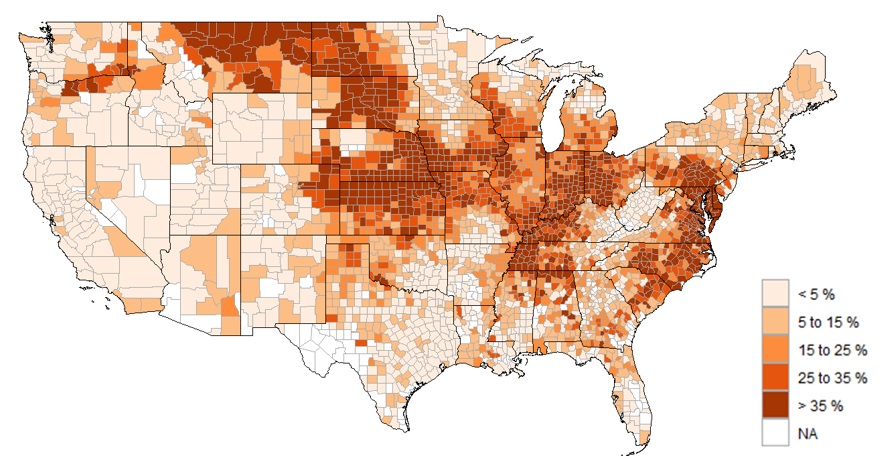
Panel A. No-Till Adoption Rate by County, 2017
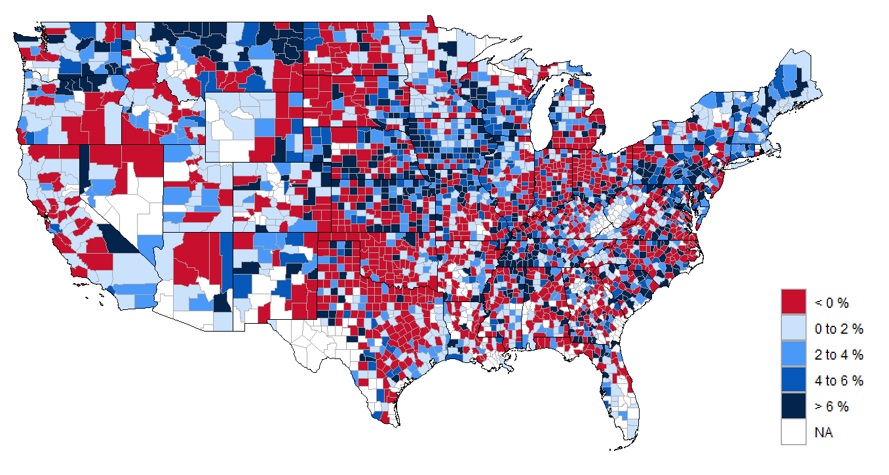
Panel B. Percentage-Point Change in No-Till Adoption Rate by
County, 2017 vs 2012
Source: Authors' calculations based on Census of Agriculture
(USDA 2014, 2019).
No-till is a much more widely adopted conservation practice than are cover crops, accounting for 26.35% of total cropland acres in 2017, up from 24.76% in 2012 (Table 1). The Northern Great Plains had the highest adoption rate (34.02%) in 2017, followed by the Heartland (30.69%) and the Southern Seaboard (27.47%). However, in parallel to the changes observed in cover crops, the Heartland region topped the list with 2.8 million additional acres in no-till, accounting for 35.32% of the total area expansion in the United States between 2012 and 2017. Five states had adoption rates exceeding 40% in 2017 (listed in decreasing order): Maryland, Delaware, Montana, Nebraska, and Tennessee (Figure 2 and Table A2 in the Appendix).
Disadoption played an even larger role in limiting the expansion of no-till than it did in limiting the expansion of cover crops. The disadoption ratio for no-till at the national level between 2012 and 2017 was 39.38% (Table 2), equivalent to about 2.5 times the disadoption ratio for cover crops over the same period. Disadoption of no-till was also more widespread than disadoption of cover crops, occurring in 35.49% versus 28.26% of all counties, respectively. If the net change in no-till adoption in the 1,084 counties that experienced disadoption had been null, the net expansion of no-till area nationwide would have been 65.0% higher, reaching 13 million acres. The following seven states, listed in descending order of disadopted acres, experienced net disadoption of no-till: Oklahoma, Texas, North Dakota, Louisiana, Indiana, Ohio, and Rhode Island (Table A2 in the Appendix).
The Northern Crescent was the most efficient region in expanding no-till area, with a disadoption ratio of 21.19%. The second most efficient region was the Eastern Uplands (22.76%), followed by the Heartland (27.40%). The most inefficient region in no-till area expansion was the Mississippi Portal, with a disadoption ratio of 70.08%. The second most inefficient region was the Prairie Gateway; half of its counties disadopted no-till between 2012 and 2017, and the disadoption ratio amounted to 66.96%. The third most inefficient region was the Southern Seaboard, where the disadoption ratio was 64.69%.
The implications of these findings are even more concerning than our findings for cover crops, since disrupting long-term use of no-till can rapidly erase the benefits accumulated over the years due to the nature of soil carbon storage. Furthermore, if disadoption ratios are interpreted as rough approximations to the regional probabilities of switching from no-till to conventional tillage over a five-year period, then voluntary environmental credit markets based on long-term no-till practices might face slim odds of success. A major challenge for the success of these markets will be to generate enough farm income from the environmental credits to offset farmers’ opportunity costs to maintain no-till in years when conventional tillage is more profitable and to pay a risk premium. Gramig and Widmar (2018) report that inducing Indiana farmers using conventional tillage to implement no-till every single year within a multi-year contract would require an annual payment of about $10.6 per acre beyond the $40 per acre increase in net revenues required to implement no-till in any given year.
| Cover Crop Adoption Ratea (%) |
Disadoption of Cover Crops 2012–2017 |
Region Totals 2012–2017 |
||||||
| Region | 2012 | 2017 | No. of Counties | Percentageb of Counties |
Change in Acres | Net Change in Acres |
Disadoption Ratio (%) |
Efficiency Rankingc |
| Heartland | 28.64 | 30.69 | 200 | 36.83 | -1,057,722 | 2,803,102 | 27.40 | 3 |
| Northern Crescent | 17.18 | 19.46 | 99 | 23.86 | -238,417 | 886,680 | 21.19 | 1 |
| Northern Great Plains | 32.07 | 34.02 | 76 | 42.46 | -953,911 | 1,827,372 | 66.96 | 8 |
| Prairie Gateway | 27.89 | 28.13 | 196 | 49.75 | -1,708,884 | 843,132 | 66.96 | 8 |
| Eastern Uplands | 17.41 | 19.03 | 146 | 35.78 | -111,144 | 377,090 | 22.76 | 2 |
| Southern Seaboard | 27.19 | 27.47 | 200 | 41.84 | -386,092 | 210,763 | 64.69 | 7 |
| Fruitful Rim | 4.76 | 6.25 | 72 | 25.99 | -182,986 | 432,376 | 29.74 | 5 |
| Basin and Range | 14.93 | 17.53 | 40 | 20.51 | -152,780 | 400,957 | 27.59 | 5 |
| Mississippi Portal | 20.28 | 21.37 | 55 | 33.33 | -363,931 | 155,361 | 70.08 | 9 |
| U.S. Total | 24.76 | 26.35 | 1084 | 35.49 | -5,155,867 | 7,936,833 | 39.98 | |
a Adoption rate calculated as no-till area divided by total cropland area. Total cropland includes cropland harvested, crop failure, cultivated summer fallow, cropland used only for pasture, and idle cropland.
b Percent of counties calculated with respect to all counties in the state (including counties with missing data).
c Efficiency ranking with respect to disadoption ratio.
Source: Authors’ calculations based on Census of Agriculture (USDA 2014, 2019).
Mapping counties that experienced disadoption of conservation practices and calculating disadoption ratios by states, watersheds, and farm resource regions opens the door to more complex and potentially more relevant questions for policy design than those that can be addressed with a single metric of net changes in area under conservation practices at the state or national level. While our analysis provides useful insights at the regional and national level, a field-level panel data study could provide even more valuable information. Understanding the motives for full adoption, partial adoption, opportunistic adoption, alternating adoption, and extent of adoption is especially important (Pannell and Claassen, 2020), given that the private and societal benefits of these practices can diminish without sustained adoption.
In addition, changes to conservation policy might be necessary as the motives for incentivizing no-till and cover crops evolve to include increasing carbon sequestration and reducing nutrient pollution to waterways. Existing cost-share programs often provide funding that declines or disappears after a certain number of years of participation, under the assumption that farmers will be more able to self-fund their conservation practices because adoption costs decline with experience, which may not always be the case. Since policy design could be a contributor to a lack of sustained conservation practice adoption, additional research is warranted to understand how farmers’ loss of program eligibility affects disadoption of conservation practices.
Future policy design could lead to more cost-effective conservation policies if a concerted research effort were made to calibrate the optimal mix of adoption-promoting versus disadoption-abating conservation programs based on localized disadoption ratios. Expanding the comparisons presented in this article by overlaying maps of disadoption of conservation practices to maps of changes in land use, erosion, water quality, and incentives programs and assistance for producers to adopt conservation practices should add valuable insights to the design of climate-smart agriculture and forestry policy.
Bowman, M., and L. Lynch. 2019. “Government Programs That Support Farmer Adoption of Soil Health Practices.” Choices 34(2): 1–8.
Claassen, R., M. Bowman, J. McFadden, D. Smith, and S. Wallander. 2018. Tillage Intensity and Conservation Cropping in the United States. Washington, DC: U.S. Department of Agriculture, Economic Research Service, Economic Information Bulletin 197, September.
Foreman, L.F. 2001. Characteristics and Production Costs of U.S. Corn Farms. Washington, DC: U.S. Department of Agriculture, Economic Research Service, Statistical Bulletin 974, August.
Gramig, B.M., and N.J.O. Widmar. 2018. “Farmer Preferences for Agricultural Soil Carbon Sequestration Schemes.” Applied Economic Perspectives and Policy 40(3): 502–521.
Growing Climate Solutions Act of 2020, H.R. 7393, 116th Congress. 2020. Available online: https://www.congress.gov/bill/116th-congress/house-bill/7393/text.
Growing Climate Solutions Act of 2021, S. 1251. 117th Congress. 2021. Temporary: https://www.agri-pulse.com/ext/resources/pdfs/RYA21384.pdf. Definitive check back on https://www.congress.gov/bill/117th-congress/senate-bill/1251.
Pannell, D.J., and R. Claassen. 2020. “The Roles of Adoption and Behavior Change in Agricultural Policy.” Applied Economics Perspectives and Policy 42(1): 31–41.
Stevens, A. 2019. “Economic Theory Provides Insights for Soil Health Policy.” Choices 32(2): 1–6.
U.S. Department of Agriculture. 2000. Farm Resource Regions. Washington, DC: U.S. Department of Agriculture, Economic Research Service, Agricultural Information Bulletin AIB-760, September.
U.S. Department of Agriculture. 2014. 2012 Census of Agriculture. Washington, DC: U.S. Department of Agriculture, National Agricultural Statistical Service.
U.S. Department of Agriculture. 2019. 2017 Census of Agriculture. Washington, DC: U.S. Department of Agriculture, National Agricultural Statistical Service.
Wade, T., and R. Claassen. 2017. “Modeling No-Till Adoption by Corn and Soybean Producers: Insights into Sustained Adoption.” Journal of Agricultural and Applied Economics 49(2): 186–210.
Wallander, S., D. Smith, M. Bowman, and R. Claassen. 2021. Cover Crop Trends, Programs, and Practices in the United States. Washington, D.C.: U.S. Department of Agriculture, Economic Research Service, Economic Information Bulletin 222, February.
Click here to access the Appendix

