The Electronic Logging Device (ELD) Mandate has been a contentious issue in the U.S. transportation industry since the “Moving Ahead for Progress in the 21st Century” Act (MAP-21; P.L. 112–141) was signed into law in July 2012. The ELD logs a commercial motor vehicle’s (CMV) engine activity and provides a graphic interface that law enforcement officers may view to determine whether a driver is compliant with hours-of-service (HOS) regulations. As such, the mandate does not change the hours-of-service regulations, but it does make it easier for law enforcement to see whether drivers are compliant. Noncompliance may result in fines and citation points deducted from commercial drivers’ licenses.
ELDs are intended to create a safer work environment for drivers by enforcing HOS regulations that limit daily driving to discourage driving while drowsy or fatigued. ELDs can also facilitate easier, faster, and more accurate management of a driver’s duty status records to enforce HOS regulations (FMCSA, 2019a). Increased road safety notwithstanding, the trucking industry is concerned that compliance with the ELD mandate will result in greater transportation times and operation costs, limit capacity, and adversely affect supply chain efficiency (Sapra, 2019). CMV drivers argue that compliance with the mandate has lowered their salaries and led to more reckless driving to “beat the clock” (Premack, 2018). For some in the agricultural industry, concerns focused on potential adverse effects for agricultural product shipments, specifically fresh produce, pollinators, and livestock (Karst, 2018b). Produce association groups lobbied the U.S. Congress with concerns that the ELD mandate in conjunction with HOS regulations would affect shipment of refrigerated cargo within critical delivery windows for perishable goods (Karst, 2018a,b).
The mandate for electronic records of CMV engine activity was included with several provisions that support the mission of the Federal Motor Carrier Safety Administration (FMCSA) to reduce crashes, injuries, and fatalities involving CMVs. The provisions seek to improve transportation safety by supporting the FMCSA’s three core principles on ensuring adequate outreach, oversight, and enforcement as CMV drivers enter the industry, remain in the industry, and are removed from the industry (FMCSA, 2016). Carriers and operators are subject to rules and regulations specified in the U.S. Code Federal Regulations Title 49. These are issued and enforced by federal agencies such as the U.S. Department of Transportation and its FMCSA agency on matters pertaining to transportation and transportation safety.
In this article, we describe the ELD mandate and analyze its effect on transportation times for fresh produce shipments that originate in California and those destined for markets in New York. California is the top producer of vegetables, fruits, and nuts (specialty crops) in the United States (U.S. Department of Agriculture, 2019) and ranks first in fresh produce shipments (Karst, 2019). Transportation services are crucial for the California agricultural industry because of the dynamic link between the state’s production to intrastate and interstate markets. New York is an important Northeast destination for fresh produce shipments from California and other states and is home to Hunts Point, the largest wholesale produce market in the world (Sowder, 2018). In considering this geography, we also examine changes in fresh produce shipment costs that correlate with the compliance date of the mandate.
A commercial motor vehicle (CMV) is any vehicle that is used as part of a business and is involved in interstate commerce. The vehicles can fit any of the CMV criteria based on gross vehicle weight, passenger transportation, or hazardous material transportation. There have been many attempts to monitor the activity and safety of CMVs. The adoption of automated devices to record drivers’ duty status information dates to the 1980s, when automatic on-board recording devices were implemented. These devices connect to vehicle engines and record drivers’ on-duty service (work hours). Eventually, electronic logs began to replace paper logs and were federally mandated in 1988 following successful lobbying efforts by the Insurance Institute for Highway Safety (FMCSA, 2018a; Steffensen, 2017). Electronic on-board recorders were expected to replace automatic on-board recording devices by 2010, but the change never materialized once the Owner-Operators Independent Drivers Association challenged proposed legislation (OOIDA, 2011).
Washington, DC: U.S. Department of Transportation, Federal Motor Carrier Safety AdministrationThe 2012 MAP-21 Act was successfully passed and the ELD mandate was implemented in three phases. The awareness and transition phase lasted from February 16, 2016, to December 17, 2017, during which time carriers and drivers subject to the rule were expected to prepare for compliance with the mandate: They could voluntarily use ELDs, automatic on-board recording devices, logging software, or paper logs and the ELDs had to be registered with the FMCSA and self-certified. Phase two, phased-in compliance, was in effect from December 18, 2017, to December 16, 2019. Drivers and carriers subject to the rule were required to use ELDs and automatic on-board recording devices. The latter were “grandfathered in” in that they had to be installed and in use prior to the start of this phase. During this time, however, agricultural transportation received an exemption to the ELD mandate. The full compliance phase for all transportation industries, including agricultural transportation, began after December 16, 2019, and requires all drivers and carriers under the rule to use ELDs.
Like the automatic on-board recording devices, ELDs must be attached to CMV engines to record drivers’ duty status data. ELDs, however, are required to meet more rigorous technical specifications, collect, and display more data than automatic on-board recording devices and require an accounting of all vehicular miles; they cannot be manually altered to avoid HOS regulations. ELDs also automatically record idle and driving times to facilitate more accurate on-duty service recordings (FMCSA, 2020). ELDs reduce the paperwork burden for motor carriers, compared to paper logs, and allow law enforcement to check drivers’ compliance with HOS regulations more easily. The FMCSA argues that ELDs create a safer work environment for CMV drivers, who might be harassed or coerced by employers to drive past maximum on-duty service (Hickman et al., 2014). According to the FMCSA (2015), the ELD mandate requires that an ELD must
CMVs older than model year 2000 are exempt from the ELD mandate.
Federal hours of service (HOS) regulations date back to 1937, when the Interstate Commerce Commission issued several rules that specified terms of operation for CMV drivers (Yager, 2009). Initial rules allowed for 10 hours of driving in 24 consecutive hours from duty start time. Once driving limits were reached, drivers were required to be off duty for at least 8 hours in two undefined periods. The rules also specified a 60- or 70-hour duty limit depending on whether CMVs were being operated over 7- or 8-day periods (FMCSA, 2015). Revisions in 1967 and in 2003 permitted up to 11 hours of driving each day but mandated that all driving occur within a 14-hour driving window that did not allow for any extensions with break periods. While the driving limits are the same, drivers are now required to be off duty for 10 hours each day. Over the years, the purpose of the HOS regulations has remained the same —to reduce transportation accidents by preventing CMV operation when drivers are fatigued and to allow for adequate opportunities for rest or sleep (Yager, 2009). Understandably, most CMV drivers in the United States must comply with HOS regulations.
There are HOS exemptions for CMV drivers transporting agricultural products. According to the Code of Federal Regulations 49 § 395.1(k), drivers can transport agricultural products within 150 air miles (or 173 ground miles) from an agricultural source without counting toward the on-duty HOS. The agricultural source is the location from where agricultural products are loaded onto an empty CMV and can include a farm field, nursery, or packinghouse. The source may also be any intermediate storage or handling location away from the original source at the farm or in the field, provided the commodity keeps its original form and is not significantly changed by processing or packing. For example, moving fruit or vegetable transplants from a nursery to the field designates the nursery as an agricultural source. Agricultural products include unprocessed crop and livestock commodities, agricultural equipment, seed, fertilizer, and other agricultural production materials (FMCSA, 2018b, 2019b). Beyond 150 air miles, the driver is subject to the HOS regulations for the remainder of the trip (FMCSA, 2019b).
These exemptions arose because of significant opposition to HOS regulations from the agricultural industry, particularly the fresh produce sector, where the key concern was that the mandate would lengthen cross-country trips by at least a day. Increasing transportation times adds to the difficulty of managing the highly perishable nature of fresh produce; food safety concerns and limited delivery windows are already unique challenges for produce transportation. Unlike dry goods, which can be stored for extended periods, fresh produce is typically not ready for loading when trucks arrive for pickup; drivers usually must wait while crops are harvested, packed, cooled, and then loaded for shipment. Under the standard HOS rules, waiting and loading would have been applied to the driver’s on-duty service but could be adjusted on paper logs. With mandatory ELD use, however, no adjustments are allowed (Linden, 2018). In June 2018, the FMCSA issued guidance clarifying the agricultural exemption to HOS regulation in the Federal Register (FMCSA, 2019b).
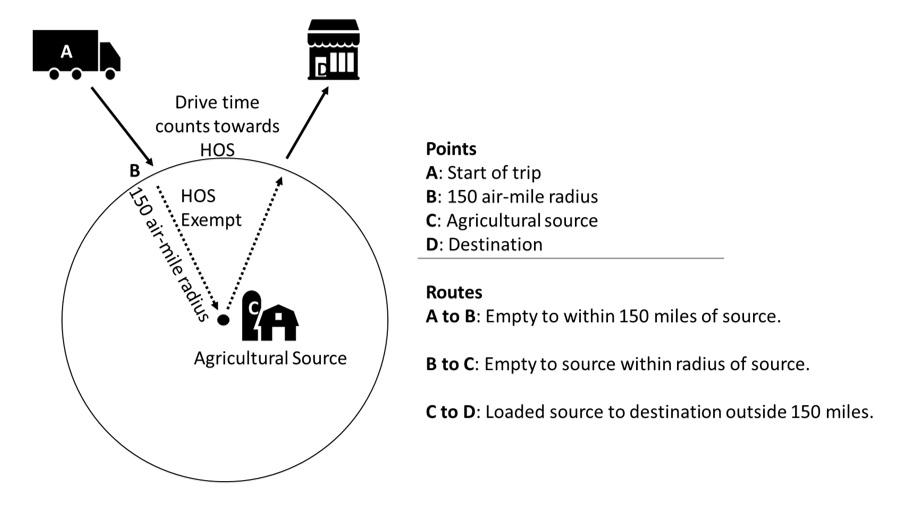
Note: Adapted from FMCSA (2019b).
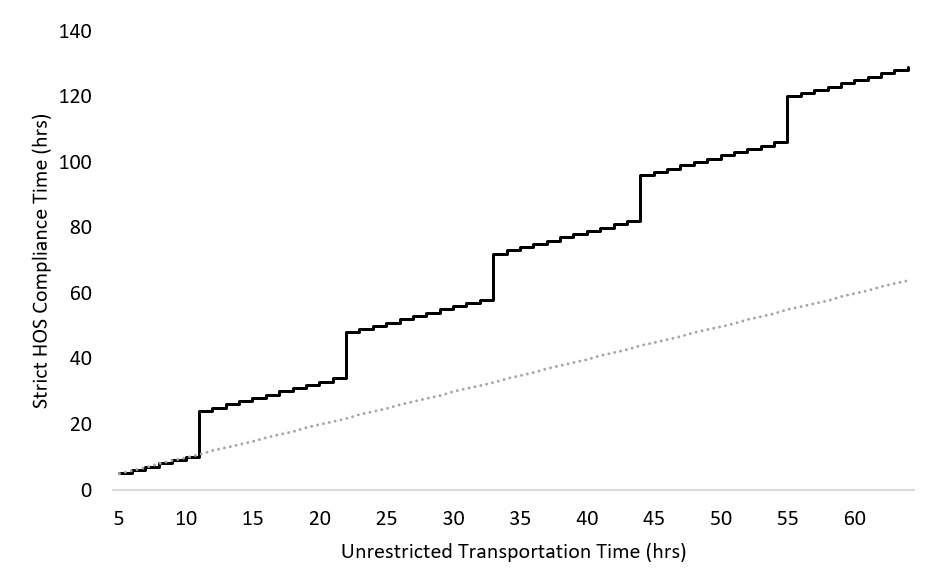
Source: Authors’ calculations.
Figure 1 illustrates a basic scenario for an agricultural exemption to HOS regulation. Points of origin (A) and destination (D) are outside the HOS-exempt radius, which starts at (B). Hours accumulated within the 150-air-mile radius are not counted toward the driver’s on-duty service, but those outside the radius are subject to the rules. If the driver returns with an empty backhaul from outside the HOS-exempt radius, the driver is subject to the HOS rules until returning to the 150-air-mile radius from where the trip began. Multiple pickups are allowed within the exemption radius, but the 150-air-mile radius continues to be measured from the first agricultural pickup location regardless of the number of times or locations agricultural products are loaded or unloaded.
Despite the agricultural exemption, drivers must maintain records of on-duty status for the eight most recent days and ELDs must note the agricultural exemption. Paper logbooks are allowed if the CMV is older than model year 2000 or if drivers do not operate outside the HOS limits for more than eight of every 30 days. It is important to note that HOS regulations do not apply to drivers transporting agricultural products completely within the 150-air-mile radius. More illustrations on agricultural exemptions are available on the Federal Motor Carrier Safety Administration website (https://www.fmcsa.dot.gov/hours-service/elds/agriculture-exemption-diagrams).
It is important to clarify that HOS regulations have not changed because of the ELD mandate. For example, CMV drivers may not drive more than 11 hours within a 14-hour window following 10 consecutive hours off duty. Hours of duty include any time spent inspecting vehicles, waiting for shipments, and loading and unloading shipments. Drivers are required to take a 30-minute rest break after eight hours of driving. Moreover, they may not drive after 60 hours on duty in seven consecutive days or 70 hours on duty in eight consecutive days (FMCSA, 2019a). What has changed, however, is that full compliance with the HOS regulations is now required and is strictly enforced with the help of the ELD mandate. The FMCSA’s Compliance, Safety, Accountability Initiative has a Safety Measurement System that rates carriers’ safety records in terms of compliance, safety, and accountability scores. The Safety Measurement System was updated to include ELD violations, which can negatively impact carriers’ scores. Drivers can be placed in out-of-service status for 10 hours and assessed fines that range from $1,000 to $10,000. Carriers are likely to incur additional costs from having drivers out-of-status and if the vehicle is towed (Matrack, 2019). There can also be additional costs incurred by other agents in the supply chain if violations occur.
Since the primary purpose of the ELD mandate is to ensure better compliance with existing HOS regulations, we speculate that transportation times increased once the mandate went into effect. As Figure 2 illustrates, trips that strictly conform to HOS regulations given the ELD mandate do not have a simple relationship to unrestricted transportation times prior to the ELD mandate, as shown by the deviation above the dotted line. The kinks in the relationship between strict HOS observance times and unrestricted transportation times occur at points where the driver would have to take a required 14-hour rest period (including 30-minute breaks and 10 hours of off-duty rest). For example, an unrestricted transportation time of under 11 hours means that a driver could potentially complete the trip in under 11 hours. A drive time over 11 hours, however, suggests that the trip will now have to also include at least one required 10-hour rest period. Box 1 provides a detailed example of how we calculate trip times based on HOS regulations.
Our calculations highlight change in transportation time between lax and strict observance of HOS rules by CMV drivers. An analogy for calculating how drive times increase in a step-wise manner can be likened to a locked cellphone, where the cellphone will lock a user out of the phone for certain amount of time if too many incorrect password attempts are made. Let’s say, for security reasons, the cellphone will lock a user out of the phone for 10 minutes for every five incorrect password attempts made. Let’s also say it takes one minute to type in each password attempt. How long will it take the user to access the phone after four incorrect attempts? How long will it take the user to access the phone after seven incorrect attempts? How long will it take the user to access the phone after 11 incorrect attempts?
4 wrong attempts = 1 + 1 + 1 + 1 + 1 = 5 minutes
7 wrong attempts = 1 + 1 + 1 + 1 + 1 + 10 + 1 + 1 + 1 = 18 minutes
11 wrong attempts = 1 + 1 + 1 + 1 + 1 + 10 + 1 + 1 + 1 + 1 + 1 + 10 + 1 + 1 = 32 minutes
We see that the time it takes to access the phone is not simply the total of wrong attempts plus the right attempt; the time it takes to access the phone also includes 10-minute security penalties for every set of five incorrect attempts. This security procedure in cellphones is analogous to calculating drive times that include HOS-mandated rest periods for transportation safety. We see that original password attempts, interspersed with security lockouts, can lead to a significantly longer time accessing one’s phone. Similarly, we see that original drive times, interspersed with mandated rest periods, can make for significantly longer travel times. Strict HOS observance with electronic logs would be analogous to a strict phone user waiting each full 10-minute lockout before attempting passwords again.
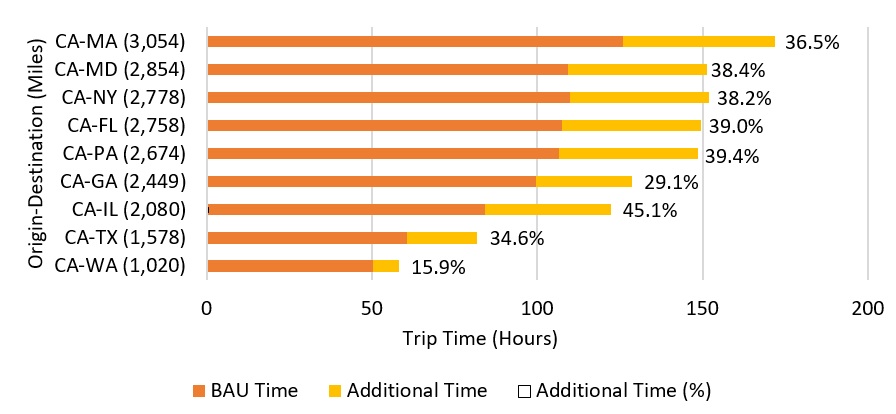
Note: Percentages reflect additional transportation times as result
of strict compliance relative to transportation times with lax
compliance.
Source: Roka, Wade, and Sprouse (2019); calculations based on
mileage from Truckrouter.com, 2020.
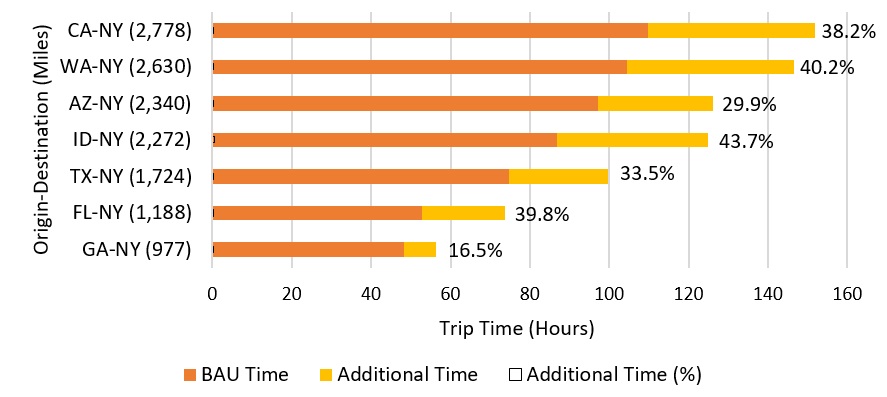
Note: Percentages reflect additional transportation times as result
of strict compliance relative to transportation times with lax
compliance.
Source: Roka, Wade, and Sprouse (2019); calculations based on
mileage from Truckrouter.com (2020).
Source: U.S. Department of Agriculture (2020).
Source: U.S. Department of Agriculture (2020).
We adopt the approach of Roka, Wade, and Sprouse (2019), who evaluated this impact by augmenting pre-ELD transportation times to express the change in transportation time due to HOS and off-duty requirements. We calculate the change in transportation times based on lax observance of the HOS regulations as reported by CMV drivers. We assess the change based on transportation times before and after the ELD mandate’s push for strict HOS compliance. We focus on interstate fresh produce shipments and assess the changes in transportation times given approximate distances between central points in specific states. California and New York are selected as origin and destination points, respectively, given their importance in the U.S. fresh produce industry: California is the largest supplier of fresh produce in the United States and New York is the largest market for fresh produce in the United States. We use routes from Truckrouter.com and compare estimates of transportation times under two scenarios: a “business as usual” scenario in which drivers are not necessarily compliant with the HOS regulations and a “strict compliance” scenario in which drivers are strictly compliant with HOS regulations as a result of the ELD mandate. Estimates assume that each trip qualifies for the agricultural exemption—in that it begins at an agricultural source and is carrying unaltered agricultural products—and that the 150-air-mile allowance is equivalent to three hours of driving.
Under strict compliance, average additional transportation time increases by 34 hours for trips leaving California and by 29 hours for trips going to New York. These trips illustrate the nonlinear effect strict compliance has on travel time described in Figure 2. As shown in Figures 3 and 4, for trips leaving California, the Washington route (the shortest route) is least impacted, with transportation times increasing by 8 hours or 16% on average, relative to the “business as usual” scenario with lax HOS observance. In comparison, trips to Illinois, though not the longest route in terms of distance or time, will add 38 hours under strict compliance and are the most impacted in terms of additional transportation time (45%) when compared to the other routes. In this illustration, routes of over 1,500 miles have increased transportation times ranging from 29% to 45%. For trips to New York, those originating in Idaho show the largest increase in additional transportation time (44%) despite it being one of the shorter routes. Interestingly, trips from Arizona are the least impacted by strict compliance and have routes longer than those from Texas or Florida.
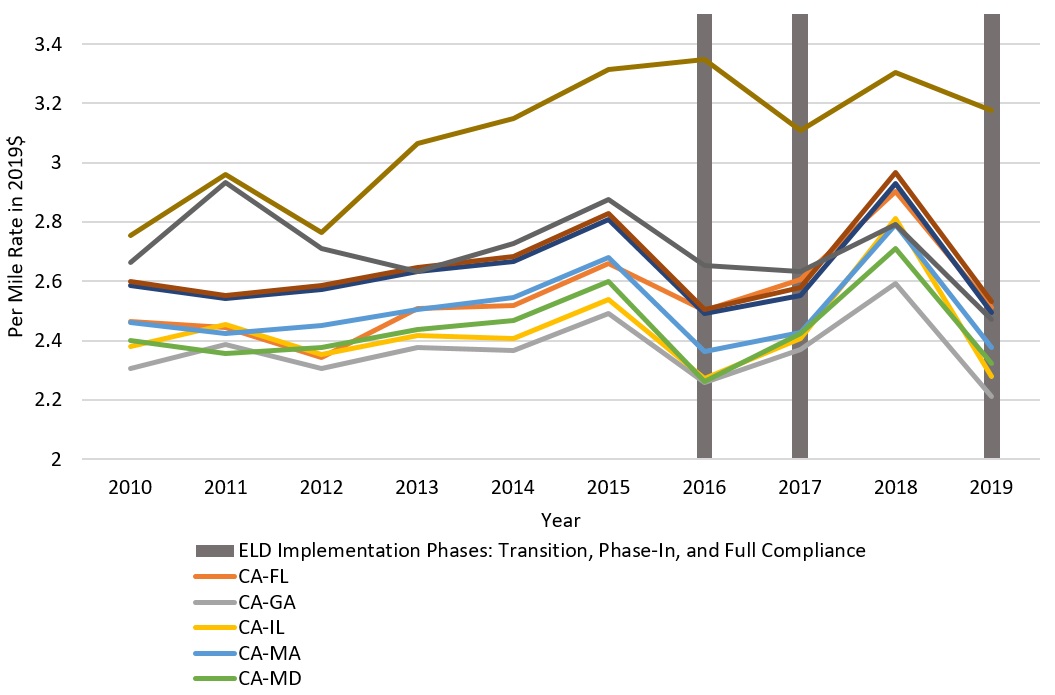
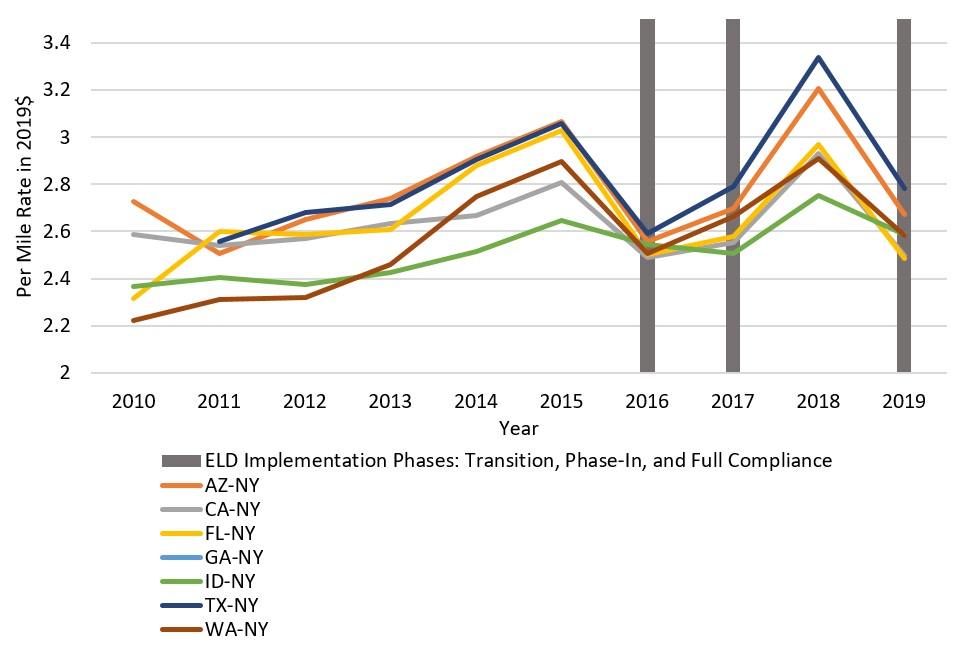
It has been argued that ELDs will reduce paperwork costs and increase fuel efficiencies (Omnitracs, 2020a,b); however, some motor carriers counter that these savings are offset by costs arising from installation of new ELD equipment and from increased transportation times (Cruz, 2017; Karst, 2018b). To assess how rates shifted, we analyze U.S. Department of Agriculture (2020) weekly fresh produce transportation cost data for 40,000-pound refrigerated trucks. We calculate average truck rates by trip and year, convert to 2019-adjusted values for comparison, and use mileage data based on Truckrouter.com estimates.
Average per mile costs for trips from California and to New York show an increase in shipping costs over time, with higher rates per mile for trips from California to Washington and trips from Arizona to New York (Figures 5 and 6). While shorter trips tend to be more expensive than longer trips, this varies from year to year. Routes show a substantial increase in cost between 2016 (the beginning of the voluntary transition phase) and 2018 (the beginning of full compliance for all industries, excluding agriculture). For most routes originating in California, excluding California to Washington, these rates increase by an average of 17% from 2016 to 2018, then decline sharply by 13% in 2019. For routes ending in New York, the rates increase by 19% between 2016 and 2018, then decline by 14% in 2019. The rate decreases after 2018 are attributed to lower fresh produce shipments; particularly from California when planting delays due to erratic weather in 2018 impacted shipment quantities while there was more than adequate truck availability (Karst, 2018a,c).
It should be noted that while all CMV drivers subject to the ELD mandate were required to have an electronic logging device by December 2017, given the limitations of our analysis, we cannot attribute rate increases to the ELD mandate. It is indicative, however, of a price shock coinciding with the phased-in compliance period. According to Karst (2018c), seasonally increasing produce shipments coupled with reduced capacity around that time frame may have played a role. Carriers’ initial responses to the mandate may have been a factor—a 2018 survey of the trucking industry reported some carriers cut back on weekly transportation mileage and loads relative to before the ELD mandate (Karst, 2018a). Authors’ interviews with truck drivers and industry experts also indicate that the ELD mandate initially created uncertainty in how drivers would make timely trips as it reduced their flexibility. However, over time (i.e., during the voluntary phase-in period), they adjusted trip logistics to ensure breaks occurred when required. Interviewers also highlighted that the new mandate may have nudged older drivers who were close to retirement to do so. These different factors increased rates during this period, causing spikes in fresh produce transportation costs.
Beyond these anticipated increases in direct transportation costs, there are additional cost implications for transporting agricultural products that are not explored in this article but may be topics for future work. First, there is limited flexibility in transportation time, which increases the potential for not making on-time deliveries. Delays caused by road construction, traffic, accidents, weather, parking, municipal idling restrictions—among other issues—influence transportation times. Other delays, such as waiting at packinghouses or loading docks, are recorded as on-duty time. These delays are difficult to plan for or avoid and increase time for on-duty service.
Second, there may be increased team driving (that is, two drivers taking turns driving the same vehicle) and the associated costs to ensure on-time deliveries. Allowing multiple drivers to operate the same CMV maximizes how long a vehicle can be in operation and decreases transportation times since one driver will be on duty while the other is resting off duty. While it is too soon to measure whether team driving has increased, it is not inconceivable that carriers, especially those involved in transportation of sensitive cargo such as livestock and pollinators, may adopt this strategy as they adapt to the mandate.
Third, there may be increased refrigeration costs as CMV drivers will be off duty for longer periods of time. Given its limited shelf life, fresh produce must be moved quickly through the supply chain and food safety standards must be strictly followed to avoid contamination. Transport refrigeration units (TRUs) are external refrigeration systems that are installed onto insulated cargo containers on CMVs (U.S. Environmental Protection Agency, 2018). TRUs are used to transport a variety of temperature-sensitive perishable goods including fresh produce, meat, dairy, beverages, flowers, and pharmaceuticals. Additional fuel and maintenance costs will be required to support longer use of TRUs during fresh produce transportation.
Much of the discussion on the potential impacts of ELDs has centered on productivity and capacity issues, particularly for smaller carriers. Given the recent implementation however, there is no clear consensus. While Law (2016) found no evidence that ELD implementation would significantly impact capacity or prices of the trucking industry, Spelic (2017) and Spotinc (2018) reported decreased productivity and reduced capacity with respect to smaller fleets and that increased freight rates were likely. Despite similar concerns with capacity in the short term, Deepak (2018) found that larger fleets implemented ELDs earlier with positive results and expected asset utilization and capacity to improve in the long run as operators made appropriate adjustments. Coker (2019) reported that owner–operators and drivers for smaller carriers were more likely to practice unsafe driving violations following the mandate, perhaps to offset productivity losses. However, that it was also encouraging the industry to innovate and more quickly adopt telematics solutions was also clear. While compliance may initially prove challenging for smaller carriers, we would expect these concerns to be less problematic over the long term.
We expect transportation carriers as well as food and agricultural distributors to make the necessary investments as they adapt to increased transportation safety regulations. ELDs represent the way of the future and provide an incentive to digitize the trucking industry. With the various inefficiencies in supply chains, made apparent during the COVID-19 pandemic, HOS regulations and the ELD mandate are changing transportation technology and encouraging innovations that aim to improve time management. Recent developments, such as Convoy and Trucker Path, have included technology platforms that complement ELDs to better align carriers and distributors while providing assistive services to drivers—all with the aim of reducing transportation times (Cassidy, 2018). Such innovations also provide valuable data that help distributors streamline their processes and improve partnerships between distributors and carriers. Certainly, more research is needed to understand the effectiveness of the ELD mandate as transportation safety regulation as well as the long-term implications for the transportation and agricultural industries.
Cassidy, W.B. 2018, March 27. “ELD Mandate Spurs Innovation in US Truck Tech.” JOC.com. Available online: https://www.joc.com/trucking-logistics/ltl-shipping/eld-mandate-spurs-innovation-us-truck-tech_20180327.html.
Coker, A. 2019. March 24. “Recent Study Finds ELD Mandate Had No Significant Impact on Crash Rates.” Freight Waves. Available online: https://www.freightwaves.com/news/trucking/recent-study-finds-eld-mandate-had-no-significant-impact-on-crash-rates.
Cruz, A. 2017, July 31. “ELD Mandate Will Increase Costs.” American Trucker. Available online: https://www.trucker.com/regulations/article/21746355/eld-mandate-will-increase-costs.
Deepak, S. 2018, February 26. “The Impact of Electronic Logging Devices on the U.S. Road Freight Market.” Beroe. Available online: https://www.beroeinc.com/article/impact-of-electronic-logging-device/.
Federal Motor Carrier Safety Administration (FMCSA). 2015. “Electronic Logging Devices and Hours of Service Supporting Documents.” Federal Register 80(241): 78292–78416.
Federal Motor Carrier Safety Administration (FMCSA). 2016, August 30. FMCSA 2015-2018 Strategic Plan. Washington, DC: U.S. Department of Transportation, Federal Motor Carrier Safety Administration. Available online: https://www.fmcsa.dot.gov/mission/fmcsa-2015-2018-strategic-plan.
Federal Motor Carrier Safety Administration (FMCSA). 2018a, April 9. Differences between AOBRDs and ELDs. Washington, DC: U.S. Department of Transportation, Federal Motor Carrier Safety Administration. Available online: https://cms8.fmcsa.dot.gov/hours-service/elds/differences-between-aobrds-and-elds.
Federal Motor Carrier Safety Administration (FMCSA). 2018b. Electronic Logging Devices. Washington, DC: U.S. Department of Transportation, Federal Motor Carrier Safety Administration.
Federal Motor Carrier Safety Administration (FMCSA). 2019a, December 18. Hours of Service. Washington, DC: U.S. Department of Transportation, Federal Motor Carrier Safety Administration. Available online: https://cms8.fmcsa.dot.gov/regulations/hours-of-service.
Federal Motor Carrier Safety Administration (FMCSA). 2020. About ELDs. Washington, DC: U.S. Department of Transportation, Federal Motor Carrier Safety Administration. Available online: https://eld.fmcsa.dot.gov/About.
Hickman, J.S., M.C. Camden, F. Guo, N.J. Dunn, and R.J. Hanowski. 2014. Evaluating the Potential Safety Benefits of Electronic Hours-of-Service Recorders Final Report. Washington, DC: U.S. Department of Transportation, Federal Motor Carrier Safety Administration.
Karst, T. 2018a, April 23. “Survey Shows Muted Supply Effect of ELD.” The Packer. Available online: https://www.thepacker.com/article/survey-reveals-muted-supply-effect-eld-enforcement.
Karst, T. 2018b, June 7. “Truck Rules Help Produce Haulers with Hours-of-Service, ELDs.” The Packer. Available online: https://www.thepacker.com/article/truck-rules-help-produce-haulers-hours-service-elds.
Karst, T. 2018c, December 22. “Year in Produce No. 5 — Trucking industry and ELDs.” The Packer. Available online: https://www.thepacker.com/article/year-produce-no-5-trucking-industry-and-elds.
Karst, T. 2019, January 1. “Number One is No Surprise on the List of Top States for Produce.” The Packer. Available online: https://www.thepacker.com/article/number-one-no-surprise-list-top-states-produce.
Law, C.H. 2016. “Impact of Regulation on Trucking Carrier Prices and Capacity.” Master’s Thesis, Massachusetts Institute of Technology.
Linden, T. 2018, July 18. “Ag Exemption Eliminates Major ELD Hurdles.” Western Growers Association. Available online : https://www.wga.com/magazine/2012/03/08/transportation-ag-exemption-eliminates-major-eld-hurdles.
Matrack. 2019, July 9. “A Comprehensive Guide to ELD Violations.” Matrack. Available online: https://www.matrackinc.com/a-comprehensive-guide-to-eld-violations/.
Omnitracs. 2020a, February 22. “ELD Facts.” ELDFacts.com. Available online: https://www.eldfacts.com/eld-facts/.
Omnitracs. 2020b, February 22. “ELD Myths.” ELDFacts.com. Available online: https://www.eldfacts.com/eld-myths/.
Owner–Operator Independent Drivers Association (OOIDA). 2011, August 29. “Truckers Triumph. EOBRs are O-U-T.” OOIDA.com. Available online: https://www.ooida.com/MediaCenter/PressReleases/pressrelease.asp?prid=206.
Premack, R. 2018, May 31. “Truck Drivers Say the Latest Measure to Keep Roads Safe Has Left Them ‘Chained Up,’ ‘More Reckless than Ever,’ and Unable to Support Their Families.” Business Insider. Available online: https://www.businessinsider.com/trucker-truck-driver-eld-salary-2018-5.
Roka, F., T. Wade, and C. Sprouse. 2019. The Electronic Logging Device Mandate, Hours of Service Rules, and Implications for Southwest Florida Produce Haulers. Gainesville, FL: University of Florida IFAS Extension Publication FE 1052.
Sapra, B. 2019, December 3. “The Federal Government Just Confirmed It Will Enforce a Law That Truckers Hate Starting This Month.” Business Insider. Available online: https://www.businessinsider.com/truckers-electronic-logging-device-eld-rule-government-will-enforce-2019-12.
Sowder, A. 2018, December 21. “Peek into New York’s Hunts Point Market: The Largest of its Kind.” The Packer. Available online: https://www.thepacker.com/article/peek-new-yorks-hunts-point-market-largest-its-kind.
Spelic, J. 2017. May 17. “How Will ELDs Impact Freight Costs in 2017 (and Beyond?)” PartnerShip. Available online: https://www.partnership.com/blog/post/how-will-elds-impact-freight-costs-in-2017-and-beyond.
Spotinc. 2018, May 24. “The True Costs of the ELD Mandate.” Spotinc.com. Available online: https://spotinc.com/news/blog/true-costs-eld-mandate/.
Steffensen, H. 2017, May 3. “A Timeline of the ELD Mandate: History & Important Dates.” GPStrackit.com. Available online: https://gpstrackit.com/a-timeline-of-the-eld-mandate-history-and-important-dates/.
Truckerouter.com. 2020. Truck Routing & Mileage Software. Available online: https://www.truckrouter.com/.
U.S. Department of Agriculture. 2020. Truck Rate Report. Washington, DC: U.S. Department of Agriculture, Agricultural Marketing Service, MyMarketNews. Available online: https://mymarketnews.ams.usda.gov/filerepo/reports?field_slug_id_value=2375.
U.S. Department of Agriculture. 2019. 2017 Census of Agriculture. Washington, DC: U.S. Department of Agriculture, National Agricultural Statistics Agency.
U.S. Environmental Protection Agency. 2018. Clean Diesel Funding Assistance Program FY 2019 Transport Refrigeration Unit (TRU) Factsheet. Washington, DC: U.S. Environmental Protection Agency, Office of Transportation & Air Quality.
Yager, T. 2009, December 7. “Commercial Motor Vehicle Drivers’ Hours of Service: Background Information.” Washington, DC: U.S. Department of Transportation, Federal Motor Carrier Safety Administration. Available online: https://cms8.fmcsa.dot.gov/sites/fmcsa.dot.gov/files/docs/Hours_of_Service_History_and_Overview.ppt.

