Federal regulation of milk prices began in 1933 as a central program in President Roosevelt’s New Deal agricultural policy (Sumner and Wilson, 2000). However, after the Supreme Court ruled that many features of New Deal programs were unconstitutional, California enacted a milk price policy in the Young Act of 1935. California adopted the main features of the price regulations that the court had said exceeded federal authority under the Commerce Clause to regulate commerce within a state. California retained its California Milk Marketing Order (CMMO) for more than 8 decades, despite the creation of a Federal Milk Marketing Order (FMMO) system under legislation later in the 1930s (Sumner and Wilson, 2000). This long-standing policy ended in 2018 with a vote to create a California Order as a part of the FMMO system administered by the U.S. Department of Agriculture (USDA).
California is an important component of the US dairy situation and outlook because California remains the largest dairy-producing state in the United States, accounting for about 18.5% of U.S. milk production, down from a high of over 20% (USDA, 2018). With California dairy consumption making up about 12% of the U.S. total, California ships milk products to the rest of the United States and the world. Milk remains the largest California farm commodity by revenue (still slightly above almonds), and milk is central to the economy of the Central Valley. The dairy industry purchases locally-produced by-products and forage and supplies raw milk to the local dairy processing industry (see data from California Department of Food and Agriculture (CDFA), https://www.cdfa.ca.gov/dairy/dairystats_annual.html and from USDA, https://data.ers.usda.gov/reports.aspx?ID=17845).
In the following sections, I review the economic drivers of this historic shift in milk price policy, outline some economically important differences between the new California FMMO and the program it replaced, and explain some major economic implications of the policy change. My main findings may be stated succinctly. First, with economic stress on dairy farmers nationally (and in many other countries), California milk producers became especially concerned about low prices in the state relative to prices in many other regions of the country. Second, the federal price formulas will likely yield higher minimum prices for milk used for cheese, while federal rules will allow processors that had been required to participate under California rules, to opt out if they find doing so to be advantageous. Third, because the new federal regulations do not change the supply and demand fundamentals for milk production in California, there seems little scope for the federal order to cause major increases in milk prices compared to the California program that it replaced.
Source: California Department of Food and Agriculture, Dairy
Division (https://www.cdfa.ca.gov/dairy/dairystats_annual.html),
and U.S Department of Agriculture (2018).
By all accounts, the California and federal marketing order systems were similar in their goals, regulatory measures, and impacts for a full 8 decades. The California order began as an attempt to implement federal policy locally to meet Supreme Court demands. That it continued for 80 years, rather than being folded into the federal system in the 1930s, mainly reflects the fact that there seemed to be no compelling reason for a change once the system was up and running. The biggest difference in the two was simply whether regulatory oversight was provided by Sacramento or Washington, DC. Over the decades, both the FMMO system and its California counterpart evolved; certain features (some details and some more basic) have been different all along. Nonetheless, the stimulus for the shift was not any specific feature of the California order but rather dissatisfaction with milk prices in California (and globally) and the perception that the California order did not do enough to protect farmers compared to policy in other parts of the country.
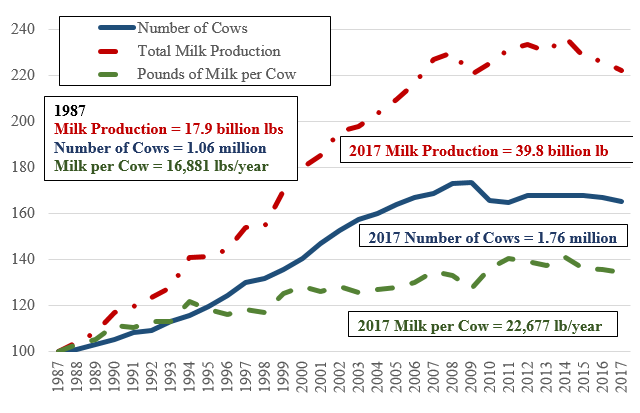
To characterize briefly what drove disaffection within California, Figure 1 considers the evolution of the industry over the past 30 years. The number of cows rose by 73%, production per cow rose by 35%, and milk production grew by a remarkable 130% in the 2 decades after 1987. But that has all come to an abrupt halt. In the last decade, milk production has been flat, cow numbers have declined, and milk production per cow has grown just slightly. An industry that had become used to remarkable growth now recognizes that it faces—at best—stagnation.
As the California dairy industry reversed its decades of growth and stagnated or declined, the rest of the United States has seen a very different picture of progress: Milk production per cow has grown steadily, the number of cows has stabilized and even grown slightly, so that total milk production rose, offsetting the fall in California.
Source: U.S Department of Agriculture (2018).
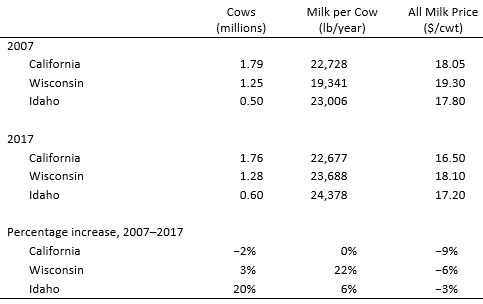
Leading up to the shift to the California FMMO, California’s position relative to other major dairy states became controversial. Compared to major competitor states Wisconsin and Idaho, California lost ground in all dimensions over the past decade (Table 1). It is remarkable that after decades of dairy productivity, California milk per cow is now relatively low compared to that of other major dairy states.
Two changes (not shown in Figure 1 or Table 1) are important to highlight. First, dairy farms have been much larger in California than in other major dairy regions. While farm consolidation has continued in California, it has occurred more rapidly in other regions. The typical size of dairy farms in states such as Wisconsin (or especially Michigan), while still much smaller than typical in California, have captured substantial scale economies. Second, milk processors have also consolidated, especially through mergers and acquisitions of milk-processing cooperatives. Two of these cooperatives, Dairy Farmers of America (based in Missouri) and Land O’Lakes (based in Minnesota), are national. Their California membership accounts for a substantial share (about 40%) of milk produced in California, and they are major processors of dry milk powder and butter in California.
While there are many reasons for decline in the California share of national milk production, one factor has been increasing costs of production and lower milk prices that have not kept up with costs. California prices fell by 9% (in nominal terms) over 2007–2017, compared to 6% in Wisconsin and 3% in Idaho. The world dairy situation over the past decade has been characterized by severe fluctuations in feed prices and milk prices that have placed the industry under stress almost everywhere.
Challenges in California include processing costs, which had been lower than those in most competitor regions but are now higher in California. Moreover, California milk processing tends to be more concentrated among the lower-priced generic products for which price premiums are unavailable. These processing problems are reflected in lack of investment. For example, recent data reported in Cheese Market News indicated that only one of the 27 major new milk processing plants from 2017 to 2020 is or will be in California (McCully, 2018). Other major dairy production regions that have attracted several new plants produce less milk than California
Milk marketing orders have many complex features and do more than regulate prices. As a price policy however, two central features are first, setting minimum prices paid by milk processors that depend on their end-use product, and second pooling or blending the revenue from milk sold for different end uses. These features imply that farmers receive a weighted average of the minimum prices that does not depend on the end use of their milk. The government does not regulate the amount of milk produced and marketed, and milk buyers may pay premiums above the government-set minimums. These over-order premiums are not pooled and provide a direct incentive to farms (or their cooperatives) to contract with a particular processor. Therefore, revenue from the “pool” does not include all milk revenue received by producers, and the weighted average of minimum prices is not equal to the actual price received by producers (Ahn and Sumner, 2009).
In line with simple economic models, the marketing order pricing rules generate price discrimination gains when higher prices are set for milk with end uses that tend to have less elastic demand functions. In practice, marketing orders set higher minimum prices for milk used for beverage and other fluid products that have more localized markets because of high transport costs. Some of the gains from price discrimination are lost through the higher marginal cost of additional production created by the price incentives. This additional milk is diverted to make more highly processed products, which depresses prices received for milk used for products, such as butter, dry milk power, whey, and cheese, which are shipped farther.
Source: U.S., Department of Agriculture, Agricultural Marketing Service
(https://www.ams.usda.gov/rules-regulations/moa/dairy/ca)
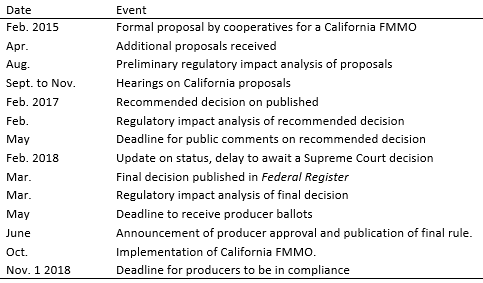
The process of establishing or modifying a federal marketing order is an elaborate, formal legal procedure that requires many steps and takes several years. The process to create the new California order began formally with a proposal from a group of dairy farmer cooperatives in early 2015 (Table 2), after a severe collapse in milk prices that occurred in 2014. Even earlier, during the period of low milk prices in 2012 and 2013, California farm groups had agitated for changes in the CMMO that they hoped would raise minimum prices, but the changes they had proposed were not implemented. Much of 2015 was spent gathering additional proposals, evaluating their likely impact, and engaging in public hearings that lasted for months. With the information they collected, the USDA spent 2016 preparing its recommendation, which was released in early 2017 with the updated impact analysis. More public comments were received and evaluated and the final decision and another update of the USDA impact analysis were published in March 2018. At that stage, the final marketing order was put to a vote.
Voting itself was anticlimactic. Cooperatives are allowed to vote on behalf of their members in a “block voting” procedure; in this case, the three large cooperatives, which controlled 80% of the votes, had already publicized their support for the new federal order. The positive vote was announced in June 2018 and the final order will be fully operational on November 1, 2018. The full record is available at www.ams.usda.gov/caorder. The Federal Register notice is available at www.federalregister.gov/documents/2018/06/08/2018-12245/marketing-orders-milk-in-california.
Three main changes may affect producer prices and marketing. The first is procedural: Under the California system, price regulations and other features of the CMMO could be adjusted periodically, sometimes monthly, with a relatively simple process whereby petitioners could request a public hearing before the CDFA, with a judgement rendered within a month or two. Thus, the California order could adjust pricing rules in response to unexpected, temporary market conditions. Federal order changes take years and are not designed to respond to temporary shifts in costs or demand.
Sources: CDFA, California Dairy Review October 2018 and earlier issues
(https://www.cdfa.ca.gov/dairy/uploader/postings/dairyreview/Default.aspx)
and USDA, AMS (https://www.ams.usda.gov/mnreports/dymclassprices.pdf).
Source: California Department of Food and Agriculture, Dairy Division.
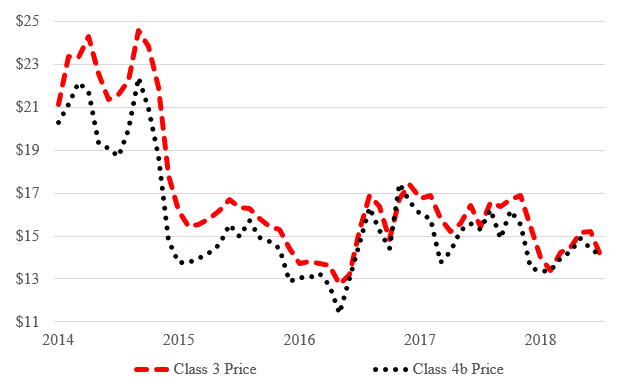
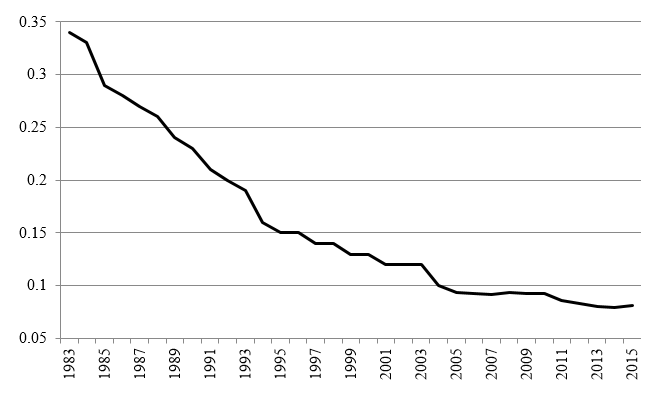
The FMMO will include some adjustments in how product and milk component categories are defined (such as combining frozen and soft products into a new class II and separating non-fat milk into protein and other non-fat solids). But the second significant change will be that the federal order is likely to impose a higher minimum price for milk used for cheese. Most observers expect a higher minimum price for Class III milk compared to California Class 4b milk because the federal order is likely to attribute more value to whey, which is a marketable by-product from cheese making. In recent years, the CMMO formula led to a lower California minimum farm price of milk used for cheese (Class 4b) than the comparable federal minimum price (Class III) (Figure 2). This difference in minimum prices was one of the motivators for the shift to the federal order. If the past is any guide, the shift to federal rules is likely to raise this minimum price of “cheese milk” by a few percent.
The third change that may prove to be economically significant is that the federal rules allow milk processing plants (other than plants making Class I products) to periodically exit and re-enter the pool pricing system. The California rules generally required mandatory participation among major milk processors. Of course, milk processors must compete for farm milk, so if they pay less for milk than their competitors they would not attract raw milk deliveries and would cease to operate. However, in some circumstances, a processor may gain from contracting for prices directly with the farms (or cooperatives) that deliver milk to their plants.
Since milk used for Class I products has a higher minimum prices, a higher proportion of these products in the pool generally raises the pool price above the regulated minimum price of milk used for cheese. But in places like California, where the Class I differential is low and the share of milk used for Class I products is low (less than 8% for milk fat and less than 14% for non-fat, based on CDFA data reported in Figure 3), the gain from pooling with Class I milk is small. This farm price gain can be easily offset by typical over-order premiums paid by cheese processors and other favorable contract features used to attract farm deliveries.
Neither the California milk pricing regulations nor the federal regulations that replace them alter the underlying market relationships that determine milk supply, demand or price (Sumner and Wolf, 1996). California remains an exporter of processed milk products that must compete on national and international markets. Despite a large population, California has a low share of milk used for beverage and other Class I uses. These factors, plus the facts that processed products made in California tend to be generic and processing costs are no longer low by national or world standards, mean that the average farm price of milk in California (the regulated minimums, plus over-order premiums and the prices for milk outside the order) will remain low compared to the U.S. national average. The change in how the government sets regulated minimum prices cannot change this supply–demand balance. California producers that deliver milk to processors that remain in the order could gain from a closer link to national minimum prices of milk used for processed products. That—plus the likelihood that much of the Class III (cheese) milk, which tends to have a low minimum price, will leave the order—may raise the marketing order pool price.
There may be shifts in prospects among processors within and across end-use classes as they adapt to the new system. Some may leave the marketing order and create new price contracts that producers find attractive or find useful risk management tools that had not been available under the CMMO or the new FMMO. Other processors may find the price necessary to attract milk will rise. All of these changes seem marginal relative to the main result that farm milk receipts seem unlikely to change much.
One potential implication of the shift to the new FMMO is that pricing and similar operations may become more convenient or effective for the large national cooperatives that operate under the FMMO umbrella in almost all other important milk-producing regions. These cooperatives may be able to streamline operations and use their new volume in the federal order advantageously in national discussions about regulations. Cooperatives are not regulated in what they must pay their members, so competition drives those payments. Adding California to the FMMO system may make pricing considerations more similar to those in other major dairy regions.
Because California is a major milk-producing region, the shift to a federal order has garnered national attention. Despite this interest, little about the economics of milk production or marketing outside of California seems likely to change. If the price of milk changes little within California, production of milk and milk products will not change much either. Milk producers, buyers, and consumers nationwide will be unlikely to notice much change.
Ahn, B., and D.A. Sumner. 2009. “Political Market Power Reflected in Milk Pricing Regulations.” American Journal of Agricultural Economics 91(3):723–737.
Erba, E.M., and A.M. Novakovic. 1995. The Evolution of Milk Pricing and Government Intervention in Dairy Markets. Ithaca, NY: Cornell Program on Dairy Markets and Policy, E.B. 95-05.
McCully,M. 2018. “What’s next for U.S. dairy plant capacity?” Cheese Market News (August). Available online: https://cheesemarketnews.com/guestcolumn/2018/24aug18.html
Sumner, D.A., and N.L.W. Wilson. 2000. “Creation and Distribution of Economic Rents by Regulation: Development and Evolution of Milk Marketing Orders in California.” Agricultural History 74(2):198–210.
Sumner, D.A., and C. Wolf. 1996. "Quotas without Supply Control: Effects of Dairy Quota Policy in California." American Journal of Agricultural Economics 78:354–366.
U.S. Department of Agriculture. 2018. Milk Production, Disposition and Income, 2017 Summary. Washington, DC: U.S. Department of Agriculture, National Agricultural Statistics Service, April. Available online: http://usda.mannlib.cornell.edu/MannUsda/viewDocumentInfo.do?documentID=1105

