The stability of agricultural commodity prices is of great interest to economists and the global community as they provide consistent income to farmers and are important for global food security, especially for food importers. Research on this topic has generated interest since at least the 1800s (for example, Patten, 1889), and the more recent volatility in prices of 2008 and 2011 generated a large amount of research aimed at explaining the causes (for example, Abbott, Hurt, and Tyner, 2008, 2011). Although agricultural commodity prices have been relatively stable since 2008/11 (with a bit of an increase in 2014), prices started becoming more volatile during the COVID-19 pandemic and, more recently (the end of 2021, beginning of 2022), have started increasing to previous 2008/11 levels.
There are numerous reasons why agricultural commodity prices have recently increased. The COVID-19 pandemic has continued, impacting supply chains, and affecting farmers’ ability to source inputs for production; Russia’s invasion of Ukraine has led to difficulties in trade leaving the region (in addition to many countries’ sanctions on Russia, although some sanctions have explicit exemptions for agricultural and fertilizer products); drought during the 2021/2022 agricultural year in South America restricted exports from that region; countries have put export restrictions in place; and energy prices have reached record highs. The Russia invasion has impacted global grain markets as around a quarter of the countries in the world (47 countries) depend on Russia and Ukraine for more than 30% of total wheat imports; 27 countries source more than 50% of their wheat imports from Russia and Ukraine (Food and Agriculture Organization of the United Nations, 2022). In addition, a notable share of the grain coming out of Russia and Ukraine is used for animal feed, driving up the cost of animal products (e.g., milk, eggs, and meat). Fertilizer prices have increased (likely, in part due to the invasion), further impacting agricultural production. For example, prospective plantings in the United States show an increase in soybean acreage and a decrease in corn acreage as the latter uses fertilizers in larger amounts than the former (U.S. Department of Agriculture, 2022).
This study decomposes the impacts to agricultural markets in 2022. To do so, we use a computable general equilibrium (CGE) model that provides a range of estimates (using three shocks—low, medium, and high) based on how impactful the shocks are for 2022. Simultaneous shocks applied in each of the three scenarios include 1) yield reductions (from higher energy and fertilizer prices); 2) export losses for coarse grains, oilseeds, vegetable, oils, and wheat from Russia and Ukraine; 3) changes in labor supply in Russia and Ukraine; and 4) a reduction in the price Russia receives for their energy exports (representing the sanctions by many importing countries).
To consider how the factors affecting agricultural markets in 2022 might impact the agricultural sector, we use a CGE model. CGE models simulate economy-wide and sectoral effects while considering the links and interactions between sectors, competition among these sectors for limited economic resources, and interactions among production, consumption, and trade activities. We use the Global Trade Analysis Project (GTAP) model and database, which has been used to analyze the European Union’s Farm to Fork program and its impact on agricultural production and trade (Beckman et al., 2020).
GTAP is a static model in that it provides estimates of economic impacts for a one-time shock. The model has 65 sectors representing the entire economy that are aggregated into rice, wheat, coarse grains (barley, corn, oats, and sorghum), oilseeds, vegetable oil, processed agriculture, manufacturing, and services. We use the latest database, which has a 2017 baseline. The model has 161 countries and regions, which we aggregate into 75 groups to understand how these shocks affect poorer countries.
The shocks in our model are based on changes that might occur from higher agricultural input prices and changes in Russia/Ukraine’s agricultural production and exports, Russia’s energy prices, and Russia/Ukraine’s labor supply. Given the uncertainty in knowing when these changes will end, we specify three scenarios for the model with varying levels of impacts (low, medium, and high). We assume a one-year time horizon, where endowments (land, labor, and capital) are somewhat immobile (land is completely immobile), representing that agricultural producers have very limited options in changing production in this time frame.
To represent the potential effect of higher agricultural input prices, we specify yield reductions for each region in the model—that is, we assume that higher prices reduce the amount of agricultural inputs used by farmers, which ultimately impacts yields. One could directly shock these input prices, but there is no consensus on what the price changes might look like. In addition, farmers purchase fertilizers at different times throughout the world (for example, due to differences in seasons), so specifying a yield shock ensures that everybody is affected in the same way.
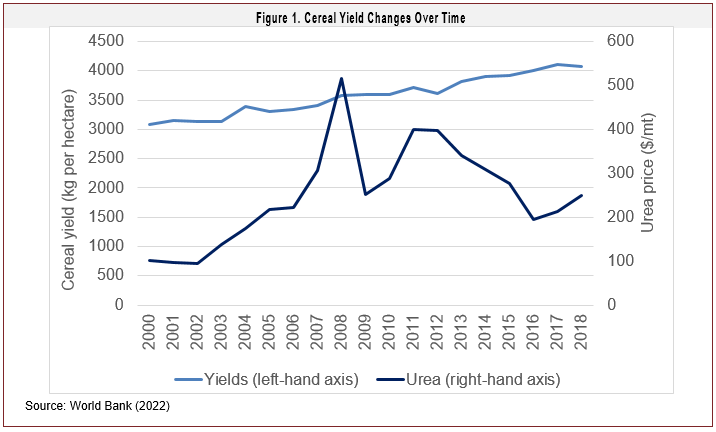
Figure 1 presents information on cereal yields by various regions over time since 2000, along with urea, a commonly used fertilizer. As indicated, global yields have increased over time, although, there was a decrease in 2012. As noted, the 2008 spike in urea prices—which coincided with the increase in agricultural commodity prices—did not seem to impact yields. Individual regions did experience a decrease (for example, North America yields decreased from 5,933 kg/hectare to 5,915 kg/hectare). This continuation of yields could have been a result of the higher commodity prices inducing farmers to use more fertilizers. Beckman and Schimmelpfennig (2015) present research that indicates that higher input and output prices are favorable to farmers in terms of farm income, although they note that most farmers would rather have stable prices. In terms of 2012, we note that the increase in urea prices occurred in 2011 and 2012, and 2012 is when the largest decrease (of 2.4%) in global yields occurred. However, it is also important to point out that the decrease in North American yields could also have been due to a large drought. Nearly 80% of agricultural land in North American was impacted by the 2012 drought (U.S. Department of Agriculture, 2012).
Along with the assumption that higher energy and fertilizer prices affect yields, we also assume that they will affect countries differently. As noted in Table 1, the yield reduction for low- and middle-income countries is more than double that for high-income countries, an assumption we make as farmers in high-income countries are more likely to be able to purchase these inputs or have sufficient fertilizer stored. One other point related to fertilizers is that a one-year increase could be negligible given that farmers can skip applications but make it up in the subsequent year. However, a more prolonged period of elevated prices, such as in 2022, can have a more detrimental impact on yields.
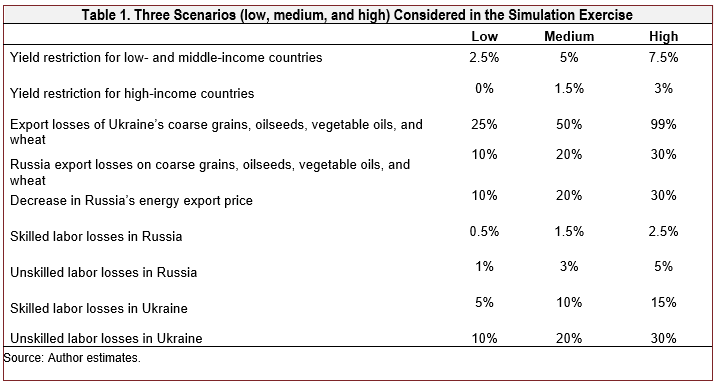
The next set of shocks is based on export losses and the difficulties that both Russia and Ukraine face in exporting their products due to political or transportation constraints. It could also be the case that they wish to keep products available for domestic consumption by restricting exports (see Laborde, 2022, for information regarding the export restrictions in place). Note that the export losses in the medium scenario are close to the range of estimates estimated by Grant et al. (2022) in this issue. We also include a decrease in Russia’s energy prices to mimic the discounts they have had to offer to have China, India, and others that buy their products. Restrictions on exports are based on those products that each country exports the most: coarse grains, oilseeds, vegetable oils, and wheat for Ukraine and coarse grains and wheat for Russia.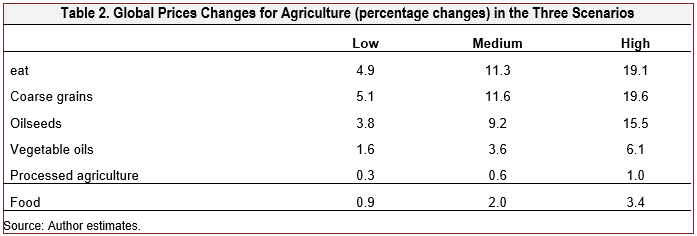
Finally, we include changes in labor in Russia and Ukraine due to fewer people being available to work the fields.GTAP differentiates between skilled and unskilled labor; we assume that unskilled labor is more impacted (double that of skilled) since these types of workers are more likely to be fighting in the war.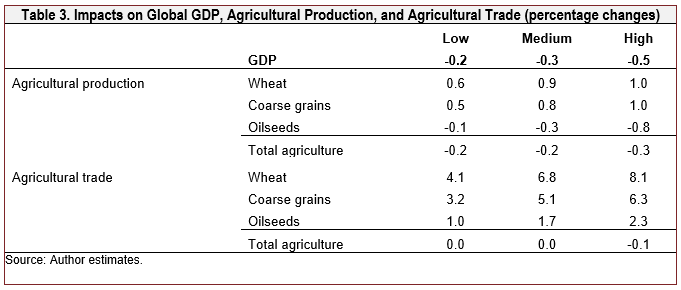
For the CGE results, we focus on changes in prices and GDP. The model estimates that wheat, coarse grains, and oilseeds all have price increases, and they are similar across all scenarios. This is because the model reallocates production to the most profitable commodity to plant. The price changes across the low to medium and high scenarios are similar across all agricultural products, with increases forthe medium scenario of more than twice that of the low scenario and further increases in the high scenario. Note that wheat and coarse grains have the largest price increases across all crops in each scenario as these are the commodities most exported by Russia and Ukraine.
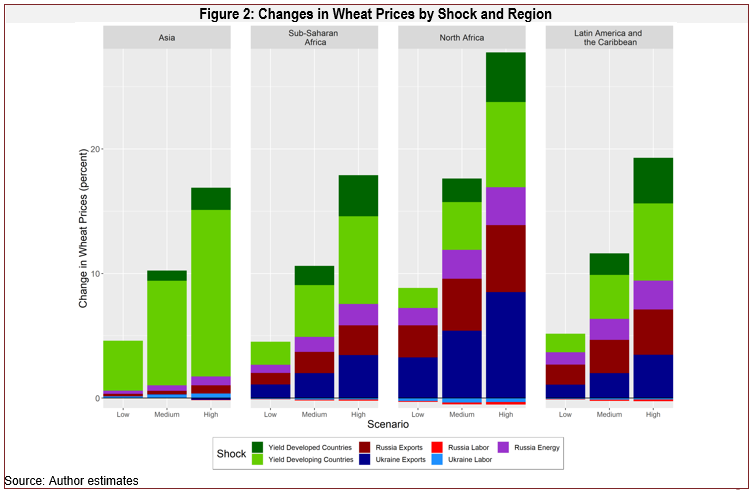
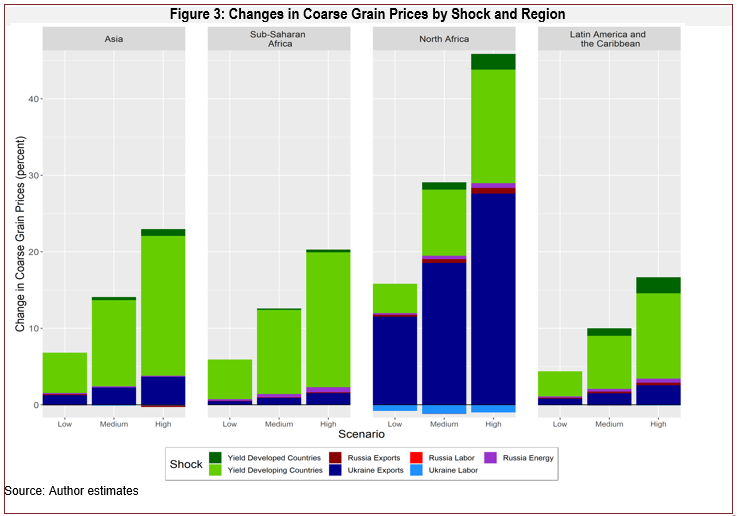
The model also estimates the percentage change in prices. Figures 2 and 3 show the decomposed price changes for wheat and coarse grains respectively, disaggregated by region. For wheat, the yield shocks primarily drive price changes in Asia. However, in North Africa, the export losses for both Russia and Ukraine comprise a large portion of the shocks. For coarse grains, reduced Ukrainian exports drive the price spikes in North Africa. The largest changes in price are for corn and wheat, which are major exports of Russia and Ukraine and are traded in high volumes. Changes in wheat prices are estimated to be highest in North Africa, as expected, as the region relies on wheat imports from the Black Sea region, and includes Egypt, the largest importer of wheat globally. The North Africa region also see the largest changes in corn prices, from 14% in the low scenario and rising to over 42% in the high scenario. Three countries in North Africa—Morocco, Tunisia, and Algeria—source a significant portion of their corn from Ukraine. For vegetable oils, the largest changes in price are expected in Asia, which includes India, a major importer of vegetable oils from Russia and Ukraine.
We also report changes in global GDP, agricultural production, and trade (Table 3). The model estimates that global GDP decreases in each scenario. Production changes are mixed. The model estimates a decrease in oilseeds production and an increase for wheat and coarse grains. Of the other crops, oilseeds compete for land in many countries with wheat and coarse grains; hence, they are the commodity that has a decrease in production (as land is shifted to wheat and coarse grains). The model indicates an increase in wheat trade (the largest increase for any agricultural commodity), despite the restrictions on Ukraine and Russia (and the fact that they make up a sizeable portion of exports). This is due to an increase in exports from other major producers such as Canada and the European Union. For coarse grains, the United States experiences an increase in exports, but many countries choose to produce wheat, and the export losses on Ukraine and Russia lead to a decrease in global trade.
In Figure 4, we show the decomposition of GDP changes by shock and region. In Asia, GDP decreases are driven by declines in yield and Ukrainian labor. In North Africa,
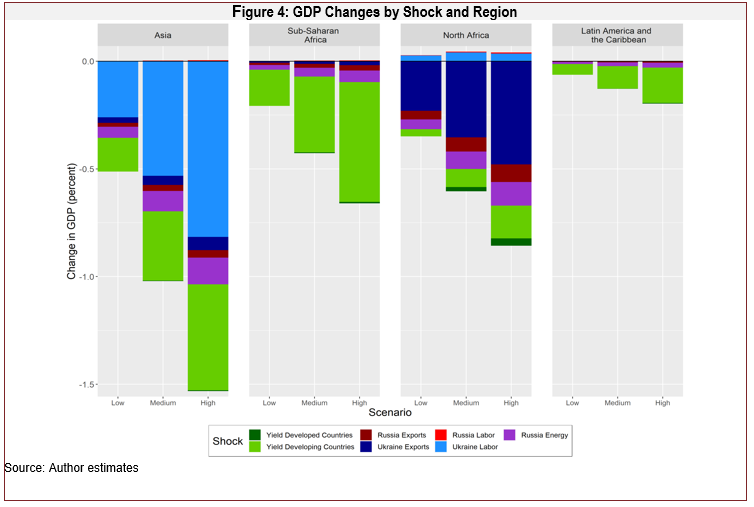
the largest driver is the decrease in Ukrainian exports, as the region purchases wheat from the Black Sea region and sells wheat flour. Global GDP is estimated to decrease in 2022 by 0.2% under the low scenario and 0.3% under the medium scenario. The steepest declines are in Asia and North Africa. By subregion, the largest decline in GDP is estimated in the CIS subregion, which includes Ukraine, with the region experiencing a decline of 1.5% under the low scenario, representing a loss of $5.7 billion (in 2015 USD), and a nearly 4.5% decline under the high scenario, equivalent to $17 billion (in 2015 USD). We do note that these estimates are only based on the shocks in this paper and do not consider the many other aspects Ukraine is experiencing due to the war that could further decrease its GDP (such as consumer spending or investment).
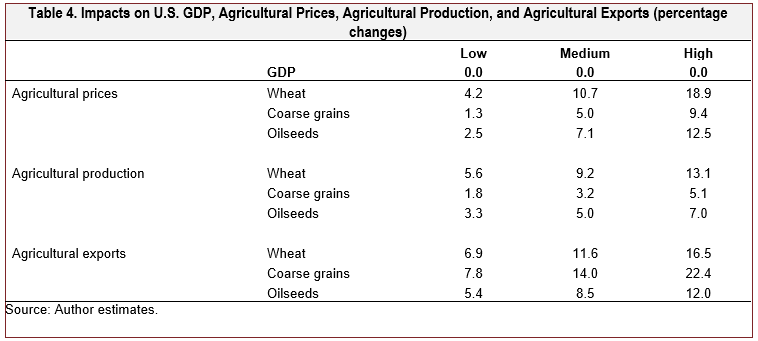
Finally, we include U.S. estimates in Table 4. The decrease in GDP is negligible as the United States is largely insulated from the changes (except for the yield reduction) and prices, production, and exports are estimated to increase. Like the global results, U.S. commodity prices increase, and the production response largely follows those changes. The United States may see an increase in agricultural production largely for exports, as the percentage changes for exports are all larger than for production.\
Previous food price increases in 2008 and 2011 were noted as the result of a “perfect storm” of factors affectingagricultural markets. The end of 2021 and 2022 have also witnessed a perfect storm affecting agricultural markets. The COVID-19 pandemic has continued to impact supply chains, affecting farmers’ ability to source inputs for production; Russia’s invasion of Ukraine has led to difficulties in trade leaving the region (in addition to the sanctions in place on Russia by many countries); drought during the 2021/2022 agricultural year in South America restricted exports from that region; countries have put export restrictions in place; and energy prices have reached record highs. There has been a safe passage deal brokered by Turkey and the UN to transport grains, but the amount is still short of what Ukraine typically exports.
To consider how these factors might affect agricultural markets, we use a computable general equilibrium model to estimate changes in prices, production, trade, and GDP. Results indicate that agricultural prices would increase across all agricultural commodities, particularly for commodities exported by Russia and Ukraine. Thus, export supply (as opposed to the yield restrictions) is the main driver of price changes in regions which are more reliant on product from the Black Sea region. Countries that tend to import grains from Russia and Ukraine are also those expected to be the most impacted in terms of food security (Zereyesus et al., 2022). Under a medium shock scenario (which most closely resembles the impacts so far this year), agricultural prices increased by between 0.6% and 11.6% across commodities. Results indicate that global GDP decreases by 0.3% in the medium scenario.
Abbott, P., C. Hurt, and W. Tyner. 2008. “What’s Driving Food Prices?” Issue Reports 37951, Farm Foundation.
———. 2011. “What’s Driving Food Prices in 2011?” Issue Reports 112927, Farm Foundation.
Beckman, J., M. Ivanic, J. Jelliffe, F. Baquedano, and S. Scott. 2020. Economic and Food Security Impacts of Agricultural Input Reduction Under the European Union Green, Deal's Farm to Fork and Biodiversity Strategies. Washington, DC: U.S. Department of Agriculture, Economic Research Service EB-30, November.
Beckman, J., and D. Schimmelpfennig, 2015. “Determinants of Farm Income.” Agricultural Finance Review 75(3): 385-402.
Food and Agriculture Organization of the United Nations. 2022, June 10. The Importance of Ukraine and the Russian Federation for Global Agricultural Markets and the Risks Associated with the Current Conflict. Rome, Italy: FAO, Information Note. Available online: https://www.fao.org/3/cb9013en/cb9013en.pdf
Grant, J., S. Arita, C. Xie, and S. Sydow. 2022. “Russia’s Invasion of Ukraine: An Initial Look at Some Global Agricultural Trade Impacts.” Choices (forthcoming).
Laborde, D. 2022. Food and Fertilizer Export Restrictions Tracker. Available online: https://public.tableau.com/app/profile/laborde6680/viz/ExportRestrictionsTracker/FoodExport
Patten, S. 1889. “The Stability of Prices.” American Economic Association 3(6): 5-64.
U.S. Department of Agriculture. 2012. “U.S. Drought 2012: Farm and Food Impacts.” Washington, DC: USDA Economic Research Service. Available online: https://drought.unl.edu/archive/assessments/USDA-ERS-2012-farm-food-impacts.pdf
———. 2022. Prospective Plantings. Washington, DC: USDA.
World Bank. 2022. Agricultural Indicators. Washington, DC.: World Bank, Available online: https://data.worldbank.org/indicator
Zereyesus, Y., L. Cardell, C. Valdes, K. Ajewole, W. Zeng, J. Beckman, M. Ivanic, R Hashad, J. Jelliffe, and J. Kee. 2022. International Food Security Assessment, 2022-32. Washington, DC: U.S. Department of Agriculture, Economic Research Service, Food Security Assessment Situation and Outlook GFA-33,

