On February 24, 2022, Russia invaded Ukraine, inflicting horrific violence on the Ukrainian people and capturing the attention of the world. The war has disrupted food supplies to people in Ukraine and to refugees who have fled to neighboring countries. In addition, because Russia and Ukraine are large producers and exporters of agricultural commodities, the war has disrupted global food supplies.
In this paper, I argue that the invasion’s effects on global food commodity markets were large but not historic. Prices have been high since the invasion, but mostly because they had increased substantially in the 18 months before to the invasion.
I based this assessment on prices. Commodity prices reflect scarcity. If a supply disruption makes a commodity scarcer, then prices increase to incentivize consumers to cut back and producers to supply more. Supply and demand for agricultural commodities are quite inelastic, which means small supply disruptions cause large price increases (Roberts and Schlenker, 2013).
Russia produces 11% of the world’s wheat and Ukraine produces 3% (see Figure 1). These countries make up a larger proportion of global exports. Russia accounts for 19% of the global wheat export market and Ukraine 9%. Ukraine is also a major corn exporter, accounting for 14% of exports. Neither country is a large player in rice or soybeans, the other two major agricultural commodities in the world.
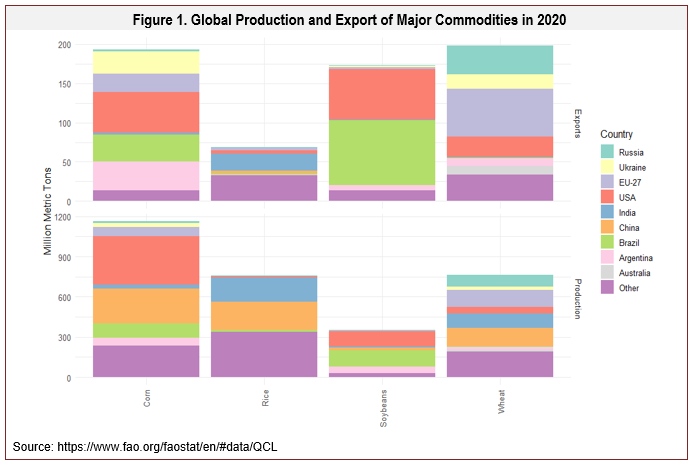
Much of Ukraine’s exports flow out through the Black Sea, where ports are currently closed and may stay closed for a long time. The potential withdrawal of some western commodity trading companies may reduce the market for its exports. China and India are the two largest consumers of wheat, but they already produce enough domestic wheat to satisfy their needs.
Has the world lost access to the 55 million metric tons of wheat and 30 million metric tons of corn exported annually from Ukraine and Russia? These quantities represent 7.3% of global wheat and 2.6% global corn production. To answer this question, we can analyze prices.
For storable commodities, such as wheat, prices will increase in anticipation of an upcoming supply disruption. If traders expect that the next year’s production will be low and they own the commodity, then they will hold onto it to sell in the future, which reduces available supply today and therefore raises prices today. This means that current prices reflect not just commodity scarcity today but also anticipated scarcity in the upcoming months and years.
Markets can be wrong. Commodity traders may have underestimated the impact of the invasion, but they also have more information about the movement and availability of grain than anyone else. Traders know, for example, that Russian and global agribusiness firms continue to operate in and export out of Russia.
Winter wheat prices increased substantially in the days following the invasion (see Figure 2). The Chicago hard red winter wheat futures price for July 2022 delivery increased by almost 50% from February 14 to its peak on March 7. The soft wheat futures contract increased by a similar percentage. Corn, soybean, and spring wheat prices increased by much less following the invasion.
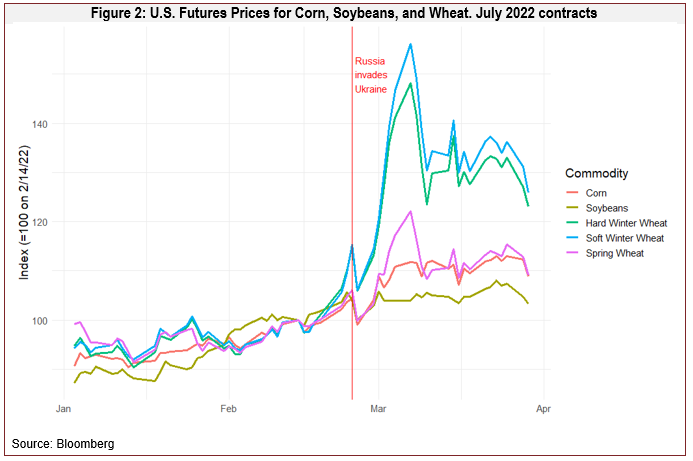
Winter wheat prices have increased by more than spring wheat prices because winter varieties make up about 95% of Ukrainian wheat and 70% of Russian wheat. Farmers planted their winter wheat several months before the invasion. It went dormant during the winter and resumed growth in the spring before harvest in the summer. The rest of Ukrainian and Russian wheat was planted in the spring for harvest in the late summer.
About two-thirds of U.S. wheat is winter wheat, mostly grown in the southern Great Plains. Bernard Warkentin originally brought hard winter wheat from Russia to Kansas in the 1870s. U.S. spring wheat is grown mostly in the upper Great Plains states, which last year experienced a severe drought that reduced yield by 33%.
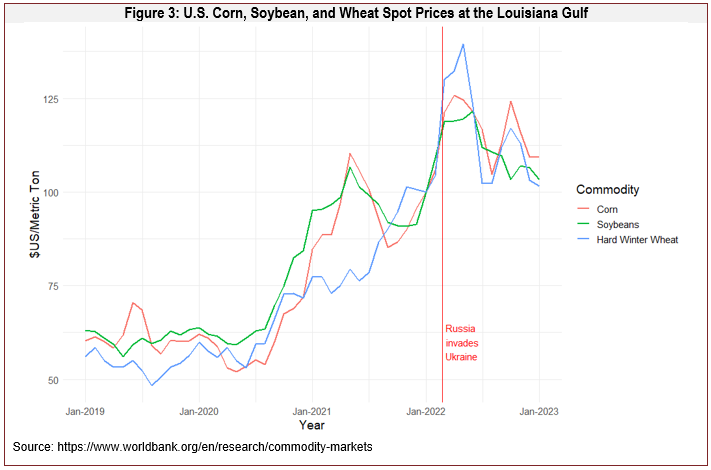
To put these price increases in perspective, Figure 3 shows spot prices since 2019 for the same three commodities. From mid-2020 through January 2022, prices approximately doubled as an array of shocks conspired to push food prices to high levels.
Futures prices for delivery at different future dates reveal how traders expect the market situation to change in the coming months. If the price for delivery this month is below the price for delivery next year, then it indicates that the commodity is relatively plentiful. Traders who store the commodity for future sale are compensated for their storage costs by the higher future price. However, if the price for delivery this month exceeds the price for delivery next year, then it indicates that the commodity is scarce right now but traders expect stocks to be replenished next year. The higher is the current price relative to the future price, the scarcer is the commodity at present.
Prior to the invasion, futures prices for imminent delivery were quite similar to prices for delivery after the 2023harvest. The hard winter wheat price for March 2022 delivery was $8.28 per bushel, compared to a price of$8.02 for delivery in December 2023 (see Figure 4). The spring wheat and corn price profiles were slightly steeper. Corn was $6.56 for March 2022 delivery and $5.61 for delivery in December 2023; spring wheat was $9.66 for March 2022 delivery and $8.98 for May 2023 delivery (most distant available). These price profiles indicate that the market for these commodities was tight (downward sloping curve), but not too tight (curve not steeply sloped).
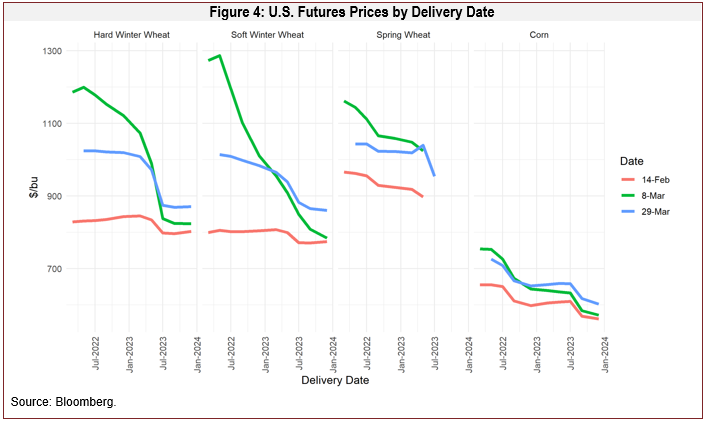
Post-invasion, winter wheat futures prices for imminent delivery increased significantly, but prices for delivery after July 2023 barely increased. The same is true for corn. The spring wheat market was already tight because of the 2021 drought, and traders expect it to remain tight beyond 2023. This pattern indicates that, as of March 8, traders expected the impact of the invasion to affect markets only for a year. By the end of March, prices for imminent delivery had declined, but prices for 2023 delivery had increased, indicating that the near-term market effects were smaller than initially feared but the ongoing effects may be larger.
Based on the observed price increases, we can infer how much grain that traders think the rest of the world has lost. In doing so, it is important to account for any substitutions across crops. For example, a reduction in wheat exportsfrom Russia and Ukraine may lead farmers in other countries to plant more wheat and less corn, and it may cause consumers to eat more rice and less wheat.
One way to do this is to aggregate across commodities, which requires measuring quantities in comparable units (e.g., dollars or calories) because a ton of rice is a very different food product than a ton of corn. Roberts andSchlenker (2013) studied supply and demand for total calories from corn, rice, soybeans, and wheat combined. They found that, for every 1% decrease in calories from these commodities, the average price increases by 7%.
On February 14, the average price of the four commodities was 15.1 cents per 1000 calories. By March 8, it had risen to 17.4 cents, an increase of 15.2%. Using the Roberts and Schlenker factor of 7, this implies a 2.2% decrease in available supply of calories. Removing 55 million metrictons of wheat and 30 million metric tons of corn entails a 2.7% reduction in available supply of calories from the big four commodities.
So, it seems that soon after the invasion, traders were banking on the world losing about three-quarters of Ukrainian and Russian grain exports (2.2/2.7). Given the large increase in winter wheat prices relative to the other commodities, most of the loss would be from wheat. Prices have decreased since March 8, which suggests that these estimated effects have been revised downwards. However, the more time that passes since the invasion, the less certain we can be that price changes are due to the invasion rather than other factors that have arisen in the interim, such as revised production expectations in other countries and possible demand reduction due to a global economic slowdown.
How common are market shocks of this magnitude? Russian and Ukrainian wheat exports were 7.3% of global production in 2020. Wheat production declined 6.3% in 2010, in part due to a drought that reduced Russian production by 20 million metric tons. Similarly large declines also occurred in 1991, 1994, 2003, and 2018. From the analysis above, the observed price increases are consistent with a 2.2% decrease in available supply of calories from corn, rice, soybeans, and wheat. Similar declines occurred in 2018, in part due to drought in Argentina and lower wheat acreage in Russia, and in 2012, in part due to drought in the United States.
What about Countries that Rely on Ukraine and Russia for Food Imports?Numerous countries, notably those in the Middle East and North Africa (MENA), import a high percentage of their calories from Russia and Ukraine. For example, wheat contributes more than a third of calories consumed in Egypt, and half of this wheat comes from Russia and Ukraine (see Figure 5). Lebanon imports about 90% of its wheat and gets most of its imports from Russia and Ukraine. These countries will need to find new suppliers this year.
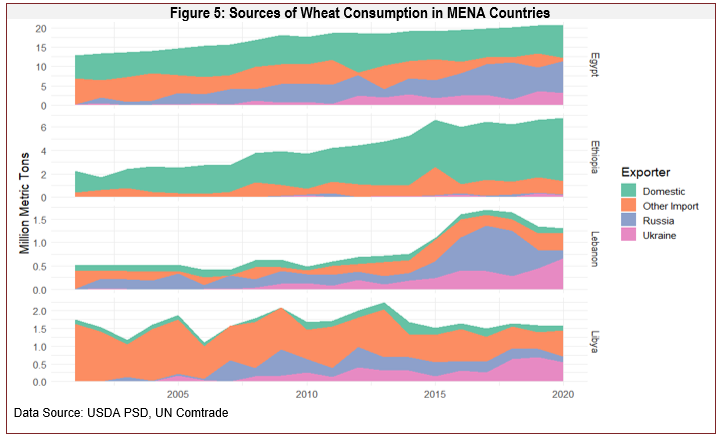
These are serious issues that can be easily overlooked by a focus on aggregate supply and demand. Low-income consumers in these and other countries can be severely affected by relatively small increases in food commodity prices, especially given that wheat prices were already relatively high before the invasion. Wealthy governments and donors can help bridge the gap by providing aid according to best practices (Lentz et al. 2013).
Fertilizers are produced throughout the world and traded heavily between countries. Russia produces 9% of global nitrogen fertilizer, 10% of global phosphate fertilizer, and 20% of global potash fertilizer. It exports more than two-thirds of its production of each product. Belarus produces an additional 17% of global potash and exports almost all of it. Ukraine produces only a small amount of fertilizer.
Fertilizer prices in spring 2022 were approximately double their levels in mid-2020 (see Figure 6). However, as with agricultural commodities, most of the price increase occurred prior to the invasion; they have not increased much since Russia invaded Ukraine.
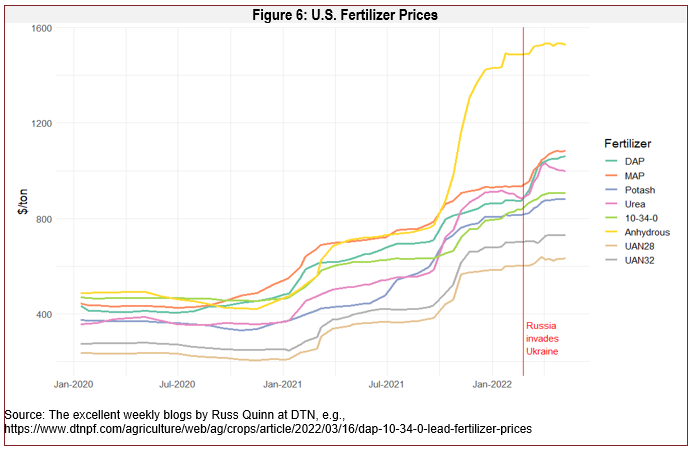
If the war cuts Russia and Belarus off from world markets, then it will leave a hole that other producers will need to fill. China produces almost all of the nitrogen and phosphate it uses, so it will not absorb Russia’s exports. However, the apparent lack of a post-invasion price spike suggests that traders are not worrying about a global shortage of fertilizer. Moreover, wheat and corn traders account for fertilizer prices when they make trading decisions. If the invasion had caused a substantial reduction in global fertilizer availability, then this would have been reflected in an increase grain and oilseed prices following the invasion.
The sunflower originated in North America and was domesticated by Native Americans. Spanish explorers carried the plant back to Europe around 1500, where it became a popular ornamental flower. It was first commercialized for oil production in Russia and Ukraine in the nineteenth century. Many now consider it a national symbol of Ukraine.
Together, Russia and Ukraine now produce more than half of the world’s sunflowers. These two countries account for most of the increase in sunflower production since 2000. This market dominance has caused many to worry thatRussia’s invasion of Ukraine will seriously affect the global vegetable oil supply.
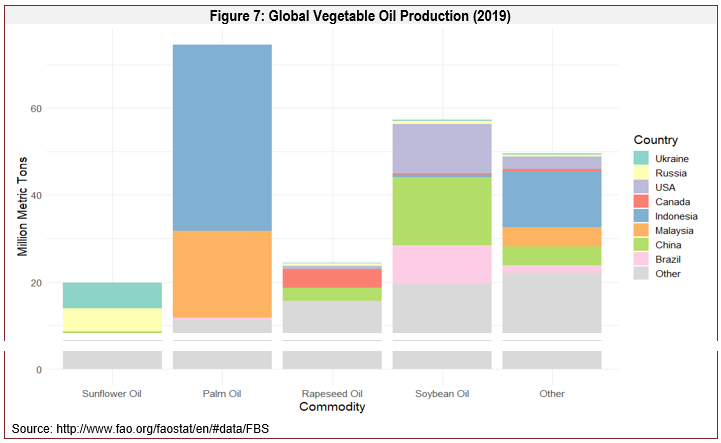
The world produced 225 million metric tons of vegetable oils in 2019, contributing about 10% of total calories consumed by humans. In the United States, vegetable oils make up 19% of calories consumed. Figure 7 shows that sunflower oil makes up less than 10% of vegetable oils. Palm oil, produced mostly in Indonesia and Malaysia, is the largest category, followed by oil from soybean and rapeseed (which includes canola and mustard). The largest category in “Other” is palm kernel oil, which is produced from the palm kernel rather than the palm fruit.
The prices of the major vegetable oils tend to move up and down together, which indicates that most consumers view them as substitutable. The prices of all oils have increased substantially since early 2020 but have not seen large increases since the invasion. This is because a large disruption to sunflower oil production has a small effect on the global vegetable oil market.
All vegetable oil users are seeing higher prices, but mostly not because of the invasion. Only users that relied on sunflower oil from Ukraine or Russia and cannot easily switch to other oils may be facing locally high prices because of the invasion.
Grain and oilseed prices approximately doubled from mid-2020 through January 2022. When Russia invaded Ukraine, winter wheat prices increased another 50%, whereas corn, soybeans, and spring wheat prices increased only moderately. I estimate that these price increases imply world markets would lose about three-quarters of Ukrainian and Russian grain exports in 2022, or about 2.2% of the available supply of calories from corn, rice, soybeans, and wheat. Most of the losses would be from wheat. These shocks are similar in size to several other global shocks in the past decade, including in 2012 and 2018.
Futures prices for 2023 delivery changed little after the invasion, suggesting traders did not expect the market disruption to last more than a year. For winter wheat, the most affected crop, there was little opportunity for supply increases to mitigate the initial shock because the 2022 northern hemisphere crop was already in the ground at the time of the invasion. The market was expecting supplies to be replenished with the new crop harvest in earlier summer 2023. After the initial shock, corn and wheat spot prices decreased somewhat, and futures prices for 2023 delivery increased. These developments indicate that the near-term market effects may be smaller than initially feared, but the ongoing effects may be larger.
By itself, Russia’s invasion of Ukraine was not a historic shock to food commodity prices, and markets and trade patterns will adjust to absorb it. Yet the shock has worsened food security in some countries, especially Ukraine. Moreover, this shock came at a time when food prices were already high. The FAO real food price index had exceeded its 2008 and 2010 highs before the invasion. It rose by 44% between June 2020 and February 2022, and it increased another 15% after the invasion. Smart food and financial aid for those most affected by high food prices is an important focus for policy responses.
Lentz, E.C., S. Passarelli, and C.B. Barrett. 2013. “The Timeliness and Cost-Effectiveness of the Local and Regional Procurement of Food Aid.” World Development 49:9–18.
Roberts, M.J., and W. Schlenker. 2013. “Identifying Supply and Demand Elasticities of Agricultural Commodities: Implications for the U.S. Ethanol Mandate.” American Economic Review 103(6):2265–2295.

