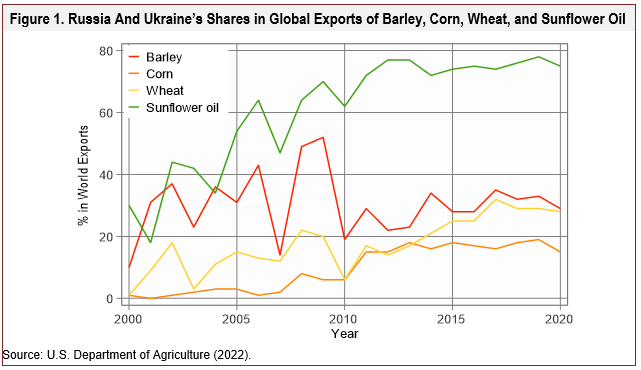
The Russia-Ukraine conflict that started in February 2022 has caused significant disruptions in the already volatile global food and fertilizer markets (Benton et al., 2022; Food and Agriculture Organization of the United Nations, 2022). These disruptions have pushed agricultural commodity and fertilizer prices to record highs (Cowley, Rodziewicz, and Cook, 2022), as Russia and Ukraine accounted for 26%, 15%, 28%, and 75% of global exports of barley, corn, wheat, and sunflower oil, respectively, in the 2020/21 marketing year (Figure 1). Additionally, in 2020, Russia was the world’s largest exporter of fertilizers. Brazil (21%), China (10%), the United States (9%), and India (4%), all critical players in global agricultural markets, were the primary destinations of Russian fertilizers (Colussi, Schnitkey, and Zulauf, 2022).
In this article, we use the Center for Agricultural and Rural Development International Agricultural Commodity Market (CARD-IACM) model to project impacts of the Russia-Ukraine conflict on global agricultural prices, production, and trade. We measure the impacts against a baseline that reflects the expected trajectory of these markets in absence of the conflict. We focus on major grain and meat products, including corn, wheat, soybeans, rice, sunflower oil, beef, broiler, and pork. While it is uncertain how long the conflict will last, we assume that its impacts on the markets will last about five years. We focus on three important questions:
Ideally, we would use actual changes in Ukrainian exports and fertilizer prices as shocks to the baseline model. However, at the time of writing, the actual changes in Ukraine’s agricultural production and exports remain uncertain. World Bank (2022) documents that imports of Ukraine corn into China, the European Union (EU), Japan, and the United States dropped by 30% and their imports of Ukraine sunflower oil fell by 50%. Fertilizer prices have risen nearly 30% since the start of 2022, following last year’s 80% surge (Baffes and Koh, 2022). Therefore, we assume reasonable shocks to both Ukraine’s exports of its major agricultural commodities and global fertilizer prices.
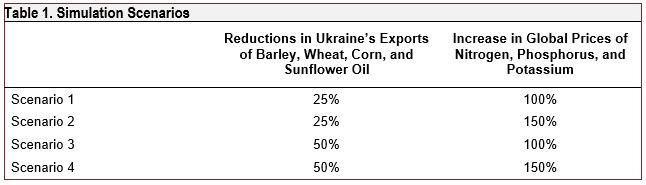
Table 1 lists our four simulation scenarios. In the baseline (i.e., the preconflict status quo scenario), Ukraine’s exports of barley, corn, wheat, and sunflower oil and the prices of the three major nutrients in commercial fertilizers (nitrogen, phosphorus, and potassium) are not affected. In Scenario 1, we assume that Ukraine’s barley, corn, wheat, and sunflower oil exports fall by 25%, while the prices of nitrogen, phosphorus, and potassium increase by 100%. In Scenario 2, we assume a 25% reduction in Ukraine’s exports of the impacted products and a fertilizer price increase of 150%. In Scenarios 3 and 4, we assume a 50% reduction in Ukraine’s exports of barley, corn, wheat, and sunflower oil and a 100% and 150% increase in fertilizer prices, respectively. Note that in the 2021/22 marketing year, Ukraine exported 22.8%, 26.3%, 1.6%, and 43.9% of its barley, corn, sunflower oil, and wheat production, respectively. We assume no shocks to Russia’s agricultural exports because the conflict has not significantly impacted Russia’s exports. Fertilizer prices are exogenous to the model. We assume that the shocks will remain for five years and focus on the projected outcomes in the 2025/26 marketing year.
These scenarios allow us to compare prices, production, and trade flows of major agricultural products, especially grains, oilseeds, and meat products across a series of plausible “what if” scenarios. They also allow us to investigate the substitution patterns across commodities as well as trade creation and diversion effects across countries under different scenarios.
The CARD-IACM model is an agricultural modeling system that can quantify the impact of market changes and policies on global land allocation, production, consumption, and trade of a broad set of agricultural and biofuel commodities (Dumortier, Carriquiry, and Elobeid, 2021). The model is comprised of 22 countries/regions with all agricultural sectors (commodities) contained within each country or region. The model places each sector’s land use within a hierarchical land-use structure within each country or region. The model assumes that per capita demand for food increases with income at a decreasing rate on the demand side. This model solves for a set of successive annual commodity prices to equate global supply and demand for agricultural products. To generate yearly projections from 2021/22 to 2025/26, we first calibrate the model using data until the 2020/21 cropmarketing year to establish five-year baseline projections for supply, utilization, and prices from 2021/22 to 2025/26. We then run the model to project agricultural prices, production, and trade under the four simulation scenarios outlined in Table 1.
Figure 2 shows the percentage changes in prices for each scenario relative to the baseline for several major commodities in the analysis for the last year of the projection (2025/26). (The full numerical results are available upon request.) In Scenario 1 (25% export reduction/100% fertilizer price increase), the prices of corn, barley, wheat, sunflower oil, rice, and soybeans increase by 24.9%, 22.4%, 18.3%, 22.5%, 11.7%, and 7.1%, respectively, in 2025/26. The prices of meat products are also higher but to a lesser extent: pork, broiler, and beef prices rise by 11.7%, 10.0%, and 8.6%, respectively. In Scenario 2 (25% export reduction/150% fertilizer price increase), the prices of crops and meat products increase by a larger magnitude than in Scenario 1.
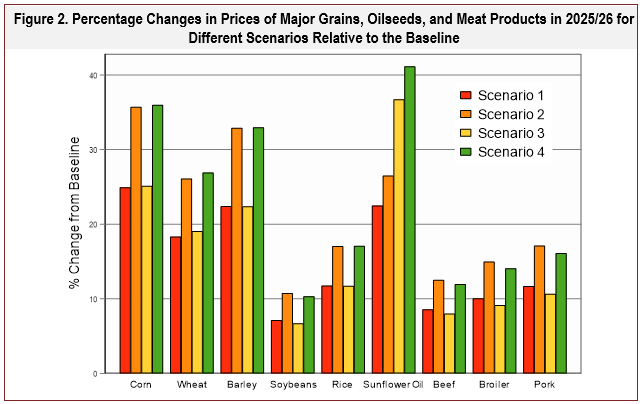
We also observe another pattern in Figure 2—the impacts of Ukraine’s export reductions on agricultural prices are smaller in magnitude than the impacts of global fertilizer prices, as shown by the smaller changes between Scenarios 1 and 3 (25% and 50% export reduction, respectively/100% fertilizer price increase) than the changes between Scenarios 1 and 2 or 3 and 4 (25% and 50% export reduction/100% and 150% fertilizer price increase, respectively). This pattern indicates that global fertilizer prices have a much larger impact on commodity prices than Ukraine’s export reductions, which makes sense given that fertilizer price increases affect all world producers and commodities.
These results show that the input and output shocks associated with the Russia-Ukraine conflict put upward pressure on the prices of both crop and livestock products. The impacts on affected products—including barley, corn, wheat, and sunflower oil—increase to a larger extent than the impacts on soybeans and rice, with meat prices increasing by a smaller magnitude than crop prices. These results make intuitive sense as Ukraine and Russia account for relatively large shares of the barley, corn,wheat, and sunflower oil export markets, and fertilizer isan important component of production costs for these commodities (in absolute terms and relative to those of other crops such as soybeans). The impact on the livestock sector is mostly indirect and caused by higher feed costs.
Figure 3 presents percentage changes from the baseline for harvested area of major crops for countries other than Russia and Ukraine (note that Ukraine’s production mix would change in response to world commodity prices and fertilizer prices). First, there is a clear pattern of the Russia-Ukraine conflict shifting cropland from corn, wheat, and rice to barley and soybeans. In Scenario 1 (25% export reduction/100% fertilizer price increase), the harvested areas for corn, wheat, and rice decline by 3.42%, 2.57%, and 0.97%, respectively. In comparison, soybean and barley harvested area increase by 0.54% and 0.75%, respectively. A partial explanation is that soybean production needs less fertilizer than other crops. Soybeans also compete most directly with corn at planting, and higher nutrient prices severely affect corn. Barley is a winter crop that competes directly with wheat, which might explain the shift toward barley. Ottman (2012) shows that barley requires less nitrogen fertilizer than wheat to obtain maximum yield; thus, the increase in fertilizer prices in the model impact wheat more. In our model, the baseline proportions of fertilizer costs to total variable costs for barley and wheat are 24.9% and 28.3%, respectively. Another potential explanation for the shift toward barley is that, in Scenario 1, the price of barley increases more than the price of wheat as Russia and Ukraine account for a larger share of global barley exports than they do wheat. This could be an additional incentive for shifting cropland from wheat to barley.
The decline in harvested area of corn, wheat, and rice and the increase in the harvested area of barley and soybeans are larger in magnitude in Scenario 2 (25% export reduction/150% fertilizer price increase) than in Scenario 1. However, in Scenario 3 (50% export reduction/100% fertilizer price increase), the declines in harvested area of corn, wheat, and rice and the increase in the harvested area of soybeans are smaller in magnitude compared with Scenario 1. This pattern indicates that because of the higher world prices shown in Figure 2, countries other than Ukraine and Russia experience lower reductions in land allocated to corn, wheat, and rice if the conflict heavily affects Ukraine’s exports.
However, the aggregate harvested area across crops could mask diverse changes across countries. Table 2 presents major producing countries’ percentage changes in the harvested area of major feed grains compared with the baseline. There is a significant difference in the impacts across countries and products caused by countries’ different crop mixes, supply elasticities, and varying production technologies, which implies that fertilizer has a varying share of the costs of producing different crops. One point worthy of attention in the interpretation of our projections is that because we try to isolate the effects of fertilizer price increases and reduced exports from Ukraine with all other things equal, the projections in Table 2 are only due to the fertilizer price changes and changes in exports from Ukraine.
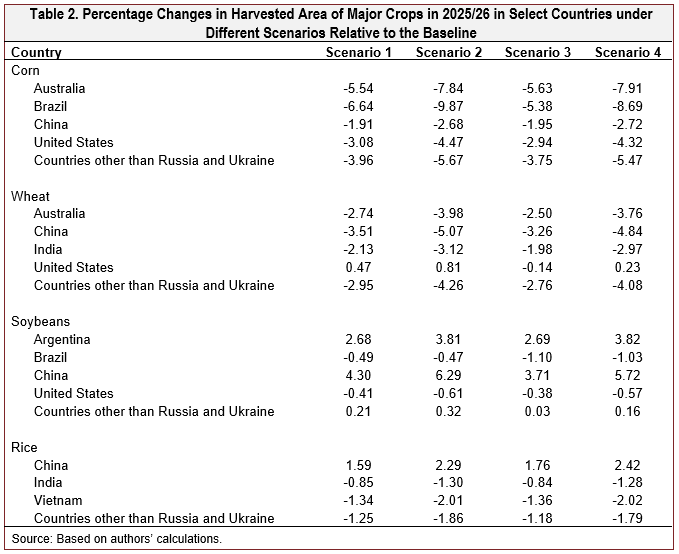
Figure 4 shows percentage changes in the production of key crops and livestock products relative to the baseline. In Scenario 1, similar to the patterns in harvested area presented in Figure 3, corn, wheat, and rice production decline by 4.08%, 2.89%, and 0.90%, respectively, while barley production increases by 0.81%. Beef, broiler, and pork production also slightly decline by 0.90%, 0.07%, and 0.28%, respectively.
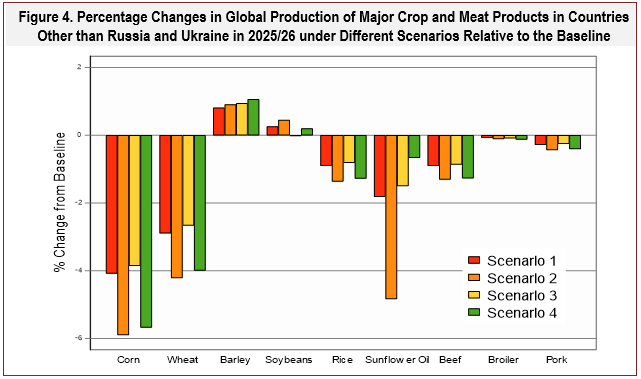
While similar patterns emerge, Figures 3 and 4 also show some differences that arise mainly due to the dissimilarity in the changes in crop area of different countries and the associated productivities (yields) of crops in those countries. For example, if a high-yield country reduces the area of a crop while a low-yield country increases the area for that crop, then, in terms of magnitude, the changes in area will be smaller than changes in production; the opposite can also occur. More generally, different combinations of changes in areas between countries and relative productivities arise, which explains the differences between Figures 3 and 4.
A comparison of Scenarios 1 and 2 indicates that a higher increase in fertilizer price decreases the production of all seven commodities except soybeans, which again suggests that higher fertilizer prices incentivize more land allocated to soybeans as it becomes relatively more profitable than other crops that compete for the same land. A comparison of Scenarios 1 and 3 indicates that larger reductions in Ukraine’s exports of barley, corn, wheat, and sunflower oil result in smaller declines in the production of corn, wheat, rice, and meat products in other countries, reflecting higher commodity prices. This points to the fact that Ukraine’s export reductions could incentivize the production of corn, wheat, and rice in countries other than Russia and Ukraine.
Table 3 presents the percentage changes in exports of key crops and livestock products relative to the baseline for major exporters. There are three interesting observations.
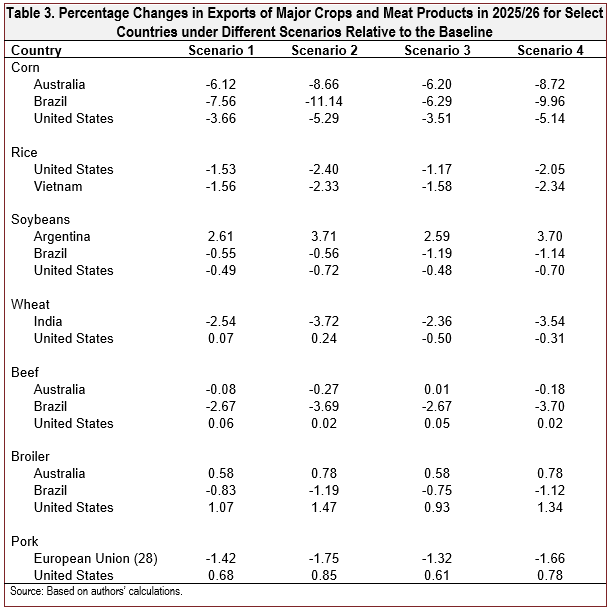
First, while higher fertilizer prices and lower Ukrainian exports lead to decreases in the exports of most agricultural products, some exporting countries benefit from the shocks. For example, in Scenario 1, Argentina’s soybean exports increase by 2.6% while Brazilian and U.S. soybean exports fall by 0.55% and 0.49%, respectively. Australian and U.S. broiler exports increase by 0.58% and 1.07%, respectively, while Brazil’s broiler exports decline by 0.83%. U.S. pork exports rise by 0.68% and those of the EU fall by 1.42%.
Second, the Russia-Ukraine conflict generally affects U.S. exports less than those of other major producers. For example, in Scenario 1, U.S. corn and soybean exports decline by 6.12% and 0.49%, respectively, while Brazil’s corn and soybean exports decline by 7.56% and 0.55%, respectively. U.S. wheat exports increase by 0.07%, while India’s wheat exports decline by 2.54%. U.S. beef exports increase by 0.06% and Brazil’s beef exports decline by 2.67%. A potential reason for the larger impact on Brazil’s corn and soybean production is that the United States relies less than Brazil does on the global fertilizer market. Another finding is that in all four scenarios, Argentina’s corn exports decline and soybean exports increase, indicating that higher fertilizer prices shift Argentina’s production from crops that rely more on fertilizers to crops that rely less on fertilizers.
Third, a comparison of Scenarios 1 and 2 indicates that a larger increase in global fertilizer price further reinforces the patterns in Scenario 1 with larger impacts in magnitude. A comparison of Scenarios 1 and 3 shows that a larger decline in Ukraine’s exports of barley, corn, and wheat results in a smaller increase in U.S. exports of broiler and meat products.
Overall, the patterns in Table 3 indicate that the fertilizer price increase will shift trade patterns and likely increase the export share of countries that rely less on world fertilizer markets. In particular, the shocks will increase U.S. export share in the pork market relative to the EU and in the corn and soybean markets relative to Brazil.
This article provided one of the first looks at the The Russia-Ukraine conflict has disrupted global agricultural markets via both input and output markets. Given that the duration of the conflict is uncertain, we have yet to see the actual impacts of the conflict on global agricultural production and trade. We use a global agricultural modeling system to simulate the impacts of the conflict on the prices, production, and trade of major feed grains and meat products, including barley, corn, rice, soybeans, wheat, beef, broiler, and pork.
There are several major findings. First, higher fertilizer prices and Ukraine’s reduced exports will push up prices of both feed grains and meat products. The impacts on affected products—including wheat, corn, and barley—increase to a larger extent than soybeans and rice, with meat prices increasing by a smaller magnitude than crop prices. Second, higher fertilizer prices and Ukraine’s reduced exports of barley, corn, wheat, and sunflower oil result in a reallocation of cropland from corn, wheat, and rice to soybeans and barley, which partially reflects that the conflict shifts cropland to crops that rely less on fertilizers. In particular, Brazil’s corn and soybean harvested area decrease by more than those in the UnitedStates. While beyond the scope of this paper, these land-use changes have environmental implications based on where the shifts in crop area occur and for which crops (see Carriquiry, Dumortier, and Elobeid, 2022, for the implications on carbon emissions). Finally, we also project that the conflict will increase U.S. export share in the pork market relative to the EU and in the corn and soybean market relative to Brazil, which indicates that the conflict could potentially shift the comparative advantage in global agricultural markets.
Our results come with some caveats and limitations. Our projections do not fully capture all potential factors that impact food prices, production, consumption, and trade, such as temporary tariff and nontariff trade measures, weather shocks, exchange rate fluctuations, and the formation of regional trade agreements in the projection period. However, comparisons of results under different scenarios provide useful benchmarks and insights for predicting the impacts of the Russia-Ukraine conflict on global agricultural markets. Finally, given the impact on grain and oilseed feedstocks, the conflict has implications for biofuel markets, protein meal, and food security. (See Carriquiry, Dumortier, and Elobeid, 2022, for the implications on food insecurity.)
Baffes, J., and W.C. Koh. 2022, May 11. “Fertilizer Prices Expected to Remain Higher for Longer.” World Bank. Available online: https://blogs.worldbank.org/opendata/fertilizer-prices-expected-remain-higher-longer
Benton, T.G., A. Froggatt, L. Wellesley, O. Grafham, R. King, N. Morisetti, J. Nixey, and P. Schröder. 2022. The Ukraine War and Threats to Food and Energy Security. London, UK: Chatham House. Available online: https://www.chathamhouse.org/sites/default/files/2022-04/2022-04-12-ukraine-war-threats-food-energy-security-benton-et-al_0.pdf
Carriquiry, M., J. Dumortier, and A. Elobeid. 2022. “Trade Scenarios Compensating for Halted Wheat and Maize Exports from Russia and Ukraine Increase Carbon Emissions without Easing Food Insecurity.” Nature Food 3:1-4.
Colussi, J., G. Schnitkey, and C. Zulauf. 2022. “War in Ukraine and its Effect on Fertilizer Exports to Brazil and the U.S.” farmdoc Daily (12):34. Available online: https://farmdocdaily.illinois.edu/2022/03/war-in-ukraine-and-its-effect-on-fertilizer-exports-to-brazil-and-the-us.html
Cowley, C., D. Rodziewicz, and T.R. Cook. 2022, May 23. “Turmoil in Commodity Markets Following Russia’s Invasion of Ukraine.” Federal Reserve Bank of Kansas City. Available online: https://www.kansascityfed.org/agriculture/turmoil-in-commodity-markets-following-russias-invasion-of-ukraine/
Dumortier, J., M. Carriquiry, and A. Elobeid. 2021. “Impact of Climate Change on Global Agricultural Markets under Different Shared Socioeconomic Pathways.” Agricultural Economics 52(6):963-984.
Food and Agriculture Organization of the United Nations. 2022, June 10. The Importance of Ukraine and the Russian Federation for Global Agricultural Markets and the Risks Associated with the Current Conflict. Rome, Italy: FAO, Information Note. Available online: https://www.fao.org/3/cb9013en/cb9013en.pdf
Ottman, M.J. 2012. Nitrogen Fertilizer Requirement of Feed and Malting Barley Compared to Wheat, 2011. Tucson, AZ: University of Arizona College of Agriculture and Life Sciences, 2011 Forage & Grain Report. Available online: https://repository.arizona.edu/handle/10150/211153 .
U.S. Department of Agriculture. 2022. Production, Supply, & Distribution. Washington, DC: USDA Foreign Agricultural Service. Available online: https://apps.fas.usda.gov/psdonline/app/index.html#/app/home.
World Bank. 2022. “Trade Watch June 2022.” Available online: https://documents.worldbank.org/en/publication/documents-reports/documentdetail/099802306162221831/idu0a163845e091f904ab108a110f88984811373

