It has been over a year since Russian forces launched an unprovoked attack on Ukraine on February 24, 2022. Beyond the serious humanitarian impacts (United Nations, 2022)—more than 7 million Ukrainians were initially displaced by the war—Russia’s invasion of Ukraine has far-reaching economic implications, including disruptions to the availability of key staple commodities, exacerbating already soaring food inflation not seen since the early 1980s, further bottlenecking of international supply chains, and reducing incomes and purchasing power in some of the world’s poorest net food importing countries. There are few certainties right now as to when and how this war ends. What is clear is that Russia’s war against Ukraine could have long-lasting geopolitical and economic consequences.
Russia and Ukraine are significant exporters of key staple grains, vegetable oil, meal and seed, and fertilizer and energy products (Paulson et al., 2022; Glauber and Laborde, 2022). Many lower-income economies depend on Russia and Ukraine for grains and oilseeds. As a result, the world finds itself grappling with a tight global supply situation and questions about food availability for the over 1 billion people residing in vulnerable net food importing countries.
For example, USDA’s July 2022 World Agricultural Supply and Demand Estimate (U.S. Department of Agriculture, 2022) projected that Ukraine will export 10 million metric tons (MMT) in the 2022/23 marketing year, nearly half its historical export totals. Global ending stocks of wheat are expected to fall by 12.6 MMT in 2022–2023, to 267.5 MMT. This could be the third consecutive decline in stocks and would represent the largest year-over-year drop in global wheat stocks since 2012. April and May were also key planting months in Ukraine for corn, spring wheat, oilseeds and pulse crops, and Ukraine’s larger winter wheat crop is planted in the fall for harvest in June of the following year (Smith, 2023; Westhoff et al., 2023).
Russia’s invasion of Ukraine has major implications for global agricultural markets. However, important questions remain:
A related question is the role of Western sanctions against Russia. Russia has claimed that sanctions have impaired global food supply, contributing to global food insecurity. The United States and European Union have denounced such claims, stating that agriculture and fertilizer products are specifically exempt (Herszenhorn, 2022; Reuters, 2022b). The U.S. Department of the Treasury (2022) issued a fact sheet to clarify that the United States has not imposed sanctions on the export of agricultural or fertilizer products from, to, transiting, or related to Russia, and these sanctions do not prohibit transactions involving insurance and reinsurance services in transportation. The EU has issued a similar fact sheet. Despite these exemptions, however, some news reports have suggested that certain banks and trading firms may still avoid transactions with Russian companies due to general uncertainty or other factors (sometimes referred to as “self-sanctioning”) (Polansek and Mano, 2022). While this study does not attempt to unpack all potential indirect effects of Western sanctions against Russia, we do provide some early empirical evidence of the de facto impact of the war on Russia’s agricultural and fertilizer exports and differential impacts on trade with its “friendly” and “unfriendly” partner countries.
This article provides an early econometric assessment of the impacts of the war on key food and agricultural exports by Ukraine and Russia to 51 partner countries using the latest available monthly bilateral trade data (January 2017 through December 2022). We control for product seasonality of commodity exports, product-specific historical trade relationships, import dependence, and export restrictions recently legislated by some countries. As of this writing, Ukraine has reported its export statistics through December 2022, which allows us to identify some preliminary impacts on the food insecure countries it serves (e.g., Egypt, Somalia, Lebanon, Bangladesh), as well as the Black Sea Grain Initiative (BSGI) which was brokered on July 22, 2022 by Turkey and the United Nations to allow the safe navigation of Ukrainian grain and oilseed exports from three ports around Odessa (Durisin, Quinn, and Nardelli, 2022; Fahim, 2022). To our knowledge, this study is one of the first to provide an initial ex post empirical assessment as to how Russia’s invasion of Ukraine has altered agricultural commodity exports from these regions.
Russia and Ukraine produce and export several staple agricultural products (Abay et al., 2022; Food and Agriculture Organization of the United Nations, 2022; Glauber, Laborde and Mamun, 2022). Table 1 illustrates key export totals and the share of Russia and Ukraine exports in world exports for calendar year 2021 (CY2021). Ukraine and Russia supply 10% and 18% of global wheat exports by value, respectively, with a combined share of over one-quarter of global wheat exports. Ukraine is also responsible for 13% of corn exports and Russia and Ukraine each account for 14% of global barley exports, or 28% combined. Ukraine, and to a lesser extent Russia, is also an important exporter of vegetable oils (namely sunflower oil). Vegetable oils are used worldwide for everything from cooking oil and dairy spreads to the making of soaps, perfumes, and hydraulic fluid. Their coproduct, vegetable meal, is an important protein ingredient for livestock feed and pet food. While Ukraine and Russia account for 73% and 81% of global sunflower oil and meal exports, respectively, their contribution to the larger overall vegetable oil and meal market is smaller at 7% (Table 1).
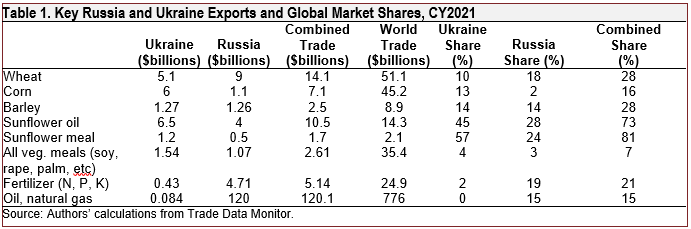
Finally, Russia is a major producer of all three fertilizer nutrient blends: nitrogen, phosphate, and potassium. Globally, 44% of fertilizer production is exported (Jones and Nti, 2022; Myers and Nigh, 2021). Russia is the largest nitrogen exporter, supplying 23% of ammonia and 14% of urea exports in 2021, and the third-largest exporter of phosphate and potash (potassium), accounting for 9% and 16% of global exports, respectively. Combined, Russia and Belarus— a close ally of Russia—account for more than 40% of potash exports. In 2021, several countries, including the EU and the United States, imposed sanctions on imports of potash fertilizer from Belarus in response to ongoing political repression and corruption associated with the Belarussian government.
According to the Food and Agriculture Organization of the United Nations (2022), nearly 50 countries depend on Russia or Ukraine for more than 30% of wheat imports. Figure 1 combines data from the USDA’s Production, Supply and Distribution tables (PSD, Left Panel) and historical (2017–2021) bilateral trade from CEPII’s BACI international trade database for 32 (mostly) low-to-middle-income economies in which wheat imports account for over 20% of total use. Iran is also included because over 20% of Iran’s wheat imports are sourced from Russia and Ukraine. Countries are sorted largest to smallest in terms of their reliance on wheat imports to satisfy domestic use (left panel).
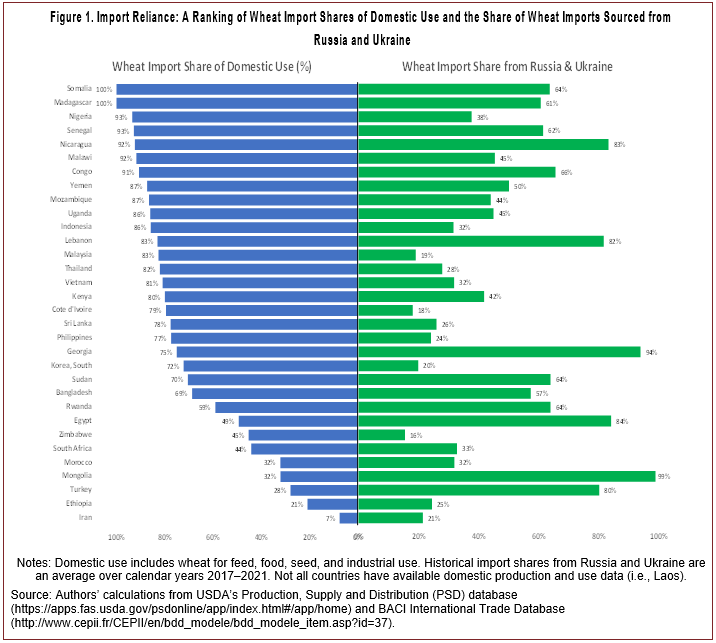
At the top of the list, Somalia, Madagascar, Nigeria, Senegal, Nicaragua, Malawi, and Congo are 90%–100% reliant on wheat imports to satisfy subsistence consumption. For Somalia, Madagascar, Senegal, and Nicaragua, over 60% of these imports are sourced from Russia and Ukraine (right panel). Other countries in which imports make up a large share of domestic use and a high dependence on Russia and Ukraine include Lebanon (82%), Georgia (94%), and Egypt (84%). Conversely, Nigeria, Indonesia, Malaysia, Thailand, Vietnam, Côte d’Ivoire, and South Korea have import shares of domestic use greater than 70%, but a relatively smaller share of those imports (<40%) depend on Russia and Ukraine. At the other extreme, Mongolia is only 32% reliant on imports for domestic use but sources 99% of its wheat imports from Russia.
When evaluating the impact of Russia’s war in Ukraine, an important consideration in the estimation of counterfactual trade losses is the seasonality of exports. Grant et al. (2019) and Grant et al. (2021) illustrate that a large share of the estimated trade damage to U.S. exports during the 2018/19 U.S.-China trade dispute occurred during the United States’s peak export months (fall season). Figure 2 plots Ukraine’s total monthly wheat, corn, vegetable oil and meal exports from January 2019 through December 2022. Several important trends are worth mentioning. First, Ukraine’s peak wheat exports occur in August–October (months 8–10, Figure 2). Historically, Ukraine’s in-season wheat exports averaged close to 4 MMT/month,compared to its offseason exports (January–July), which averaged close to 1 MMT/ month. A similar seasonal pattern exists for Russian wheat exports (not shown to save space).
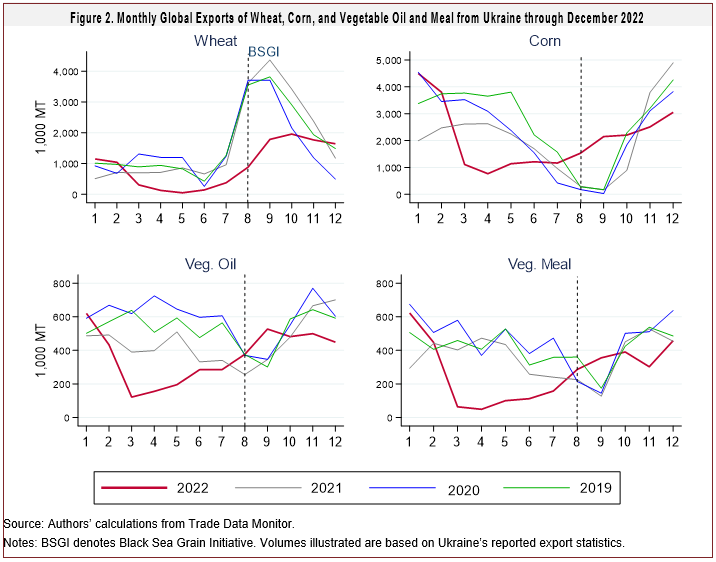
Second, Ukraine’s monthly corn exports are counterseasonal to its wheat exports, and peak (in-season) from December through May. Up to 30% of Ukraine’s $4.8–$5.8 billion in annual corn exports (roughly 25–30 MMT) since 2019 has been exported to China. Other key destination markets include the EU, Egypt, Turkey, Iran, Tunisia, and South Korea. In-season Ukrainian corn exports averaged 3–4 MMT/month and are exported to over 100 countries, compared to less than 1 MMT/month in the offseason months (May–September).
Third, Ukraine is also an important exporter of vegetable oil and meal (predominantly sunflower but also rapeseed and soy), with peak exports of between 400,000 and 600,000MT/month and serving over 170 countries (Figure 2). With the exception of September each year, Ukraine’s vegetable oil and meal exports exhibit less seasonality.
Finally, the heavier red line in Figure 2 traces Ukraine’s exports in 2022 and provides a first look at the economic toll of Russia’s invasion. In the initial months March–June 2022, Ukraine’s out-of-season wheat shipments were down by 75% or more, with total losses averaging 750,000 MT/month; corn exports declined 75% or more from an average of 3-4 MMT/month to 1 MMT/month or less; vegetable oil exports dropped from 600,000 MT to less than 200,000 MT in March–May 2022 but have since slowly recovered; and vegetable meal exports were down from 500,000 MT/month to less than 100,000 MT/month and remained below trend through July 2022.
The vertical dashed line over August (month 8) in Figure 2 illustrates the entry into force of the BSGI. Note how the BSGI initially facilitated Ukraine’s out-of-season corn exports above trend, and relatively larger exports of vegetable oil and meal compared to historical export levels. In November and December 2022 (months 11–12), corn, vegetable oil and meal exports have since fallen below trend. Ukraine’s wheat exports were in-season when the BSGI entered into force, and while the grain deal has increased Ukraine’s 2022 wheat exports, export shipments in August through October 2022 were not enough to reach Ukraine’s historical export levels during these months.
We conducted a short-run, ten-month, ex-post econometric evaluation of the Russia-Ukraine conflict on key agricultural exports by the two countries. The model includes controls for seasonality (within-year dimension), country-pair-product specific effects capturing historical trade relationships and import dependencies, export restrictions recently legislated by some countries on certain food and fertilizer exports (Laborde, 2022), and the August 2022 Black Sea Grain Initiative. The impact on exports of Ukraine and Russia’s exposure to the war are specified as indicator variables equal to 1 for Ukraine and separately for Russian exports beginning in March 2022 and extending through December 2022 relative to monthly historical exports in these same months in 2017–2021.
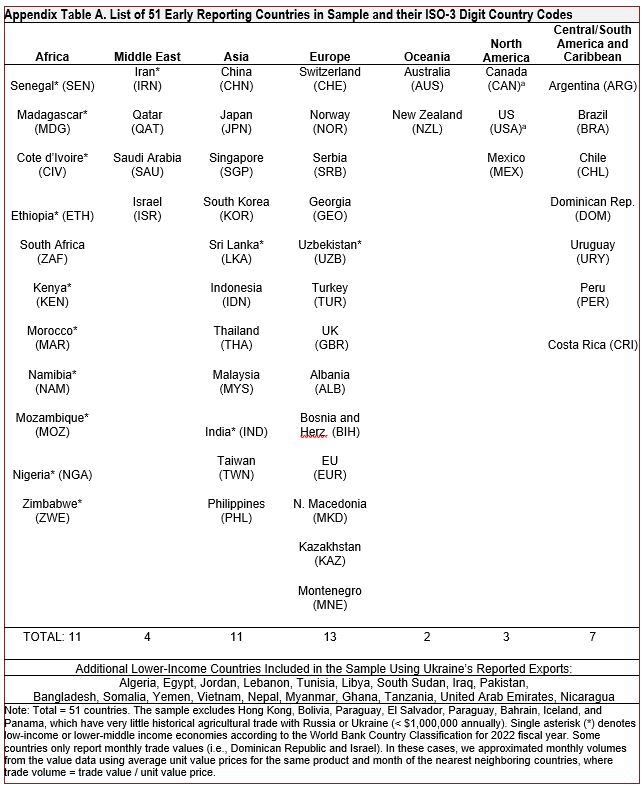
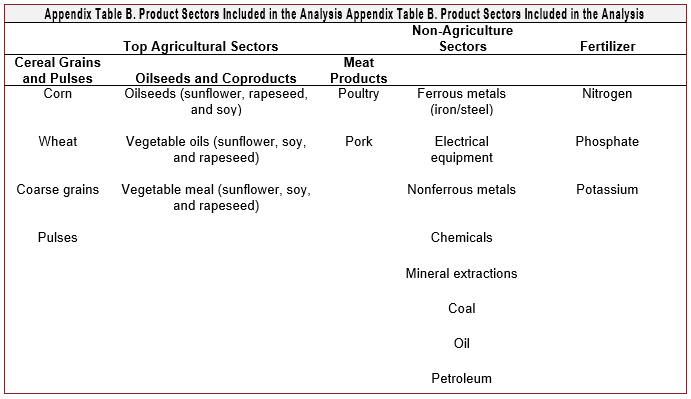
In April 2022, the Federal Customs Service of Russia suspended its national statistics until further notice. In May2022, Belarus followed. Thus, to capture the potential trade impacts of the war on Russia’s exports, we rely on 51 countries’ reported imports. High-frequency monthly bilateral trade volumes are retrieved from Trade Data Monitor (https://tradedatamonitor.com/). The initial analysis is constrained to “early reporters”—a set of 51 countries that have reported HS6-digit bilateral imports from and exports to their partner countries through December 2022. Appendix Table A groups these countries regionally along with other lower-income countries using Ukraine’s reported export statistics. Appendix Table B lists the product sectors included in the empirical analyses.
To what extent has Russia’s war in Ukraine impacted key agricultural exports? Table 2 presents the results across eight categories: Ukraine’s top agricultural export sectors combined (cereal grains, oilseeds and coproducts, andmeat products) and individually for cereal grains, oilseed,meat, fertilizer, and a combined category of Russia andUkraine’s top nonagricultural exports (see Appendix Table B). For grains and oilseeds, we also report coefficient estimates from a model that includes separate variables before (pre-BSGI) and after (post-BSGI) the Black Sea Grain Initiative. We focus on two econometric coefficients in the model: (i) 51 countries’ imports from Ukraine giventhe war and (ii) the same 51 countries’ imports from Russia given the latter’s claims of (indirect) sanction effects.
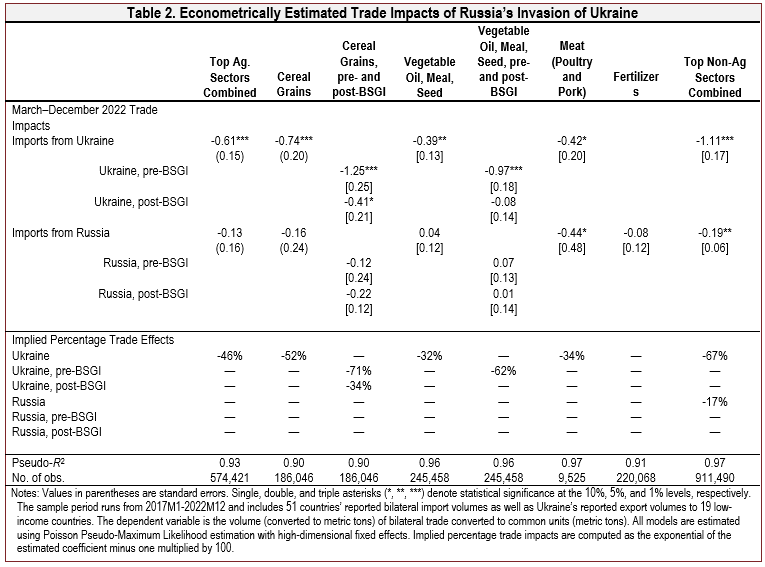
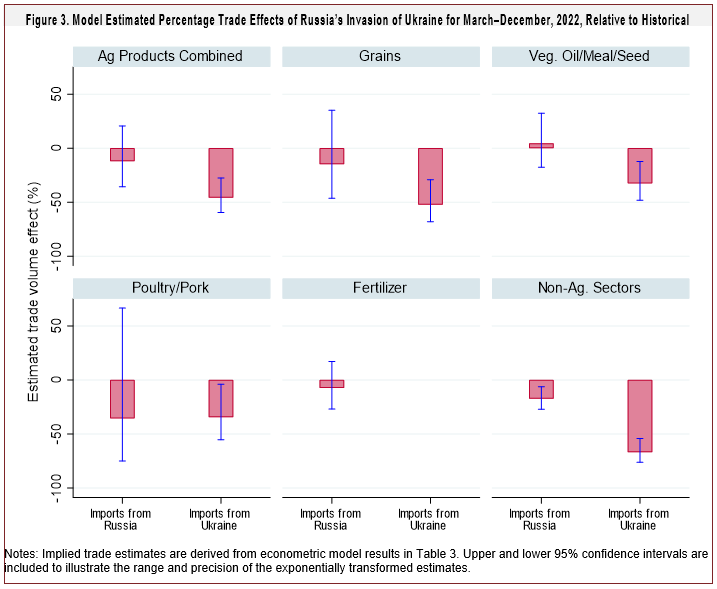
The results in Table 2 are suggestive of a large, negative, and statistically significant trade volume effect across most product categories exported by Ukraine and underscores the significant economic toll of the war on its staple food exports. Overall, from March through December 2022, model results suggest that Russia’s invasion has reduced Ukraine’s top agricultural exports by 46% on average. Among agricultural export categories, Ukraine’s cereal grain exports show the largest percentage trade reductions at 52%. Oilseeds and coproducts and Ukraine’s poultry and pork meat exports experienced smaller but still economically significant overall trade volume reductions of 32% and 34%, respectively in 2022. With the exception of meat and nonagricultural exports, none of the coefficients for Russia’s agricultural exports of cereal grains, oilseeds, or fertilizer are economically or statistically significant. This suggests that Russia’s exports have experienced little impact from its invasion of Ukraine relative to the same product-month exports in the historical period (2017–2021). This finding is consistent with the exemptions for agriculture and fertilizers from sanctions and may also suggest some indirect effects whereby countries not enforcing any type of sanctions, or that have more neutral or allied relations with Russia, could be absorbing additional Russian exports. In the next section we try to unpack some of these results. Figure 3 plots the overall implied percentage trade effects of the March–December 2022 model specification.
For cereal grains and oilseeds, we also report the results from a model that incorporates pre- and post-BSGI trade effects in Table 2. This scenario allows us to examine the importance of the BSGI in restarting Ukraine’s exports inthe August–December 2022 period relative to the impactsof Russia’s invasion before the agreement (March–July2022). Two key results are worth emphasizing. First, the onset of Russia’s invasion in the pre-BSGI period (March–July 2022) resulted in a 71% decline in Ukraine’s cereal grain exports. The war’s impacts in the pre-BSGI period was also significant for Ukraine’s oilseed exports resulting in a 61% reduction. Second, the entry into force of the BSGI has significantly improved Ukraine’s cereal grain and oilseed exports. Although the trade flow effect of Ukraine’s cereal grain exports is estimated at -34% compared to export levels predicted by the model (Table 2), the estimated effect is less than half the pre-BSGI trade effect for cereal grains of -71%. In the case of Ukraine’s oilseed product exports, the post-BSGI trade flow effect is insignificant meaning there is no statistical difference between Ukraine’s oilseed exports in the August–December 2022 period compared to the same months in the historical period. In other words, not only has the BSGI helped restart the safe passage of Ukraine’s grain and oilseed exports, in the latter product category, the initiative has essentially resumed Ukraine’s export volumes at levels consistent with its export capacity.
Russia has made several announcements threatening to restrict or halt exports of agricultural and fertilizer products to so-called “unfriendly” nations, those that have applied sanctions or otherwise supported the use of sanctions against Russia. In April 2021, nearly a year prior to the invasion, Russia published an “unfriendly list” of countries as a means to introduce countermeasures, including currency and trade restrictions. Initially the list included the United States and Czech Republic over diplomatic rifts that preceded Russia’s invasion of Ukraine (The Economist, 2021). Following its invasion of Ukraine and in response to countries imposing sanctions, by March 2022 Russia’s “unfriendly list” of countries had increased to 48. The role of this “unfriendly list” and its potential impacts on Russia’s export patterns is not clear. While Russia has brought attention to using its food exports as a geopolitical instrument—former Russian president Dmitry Medvedev threatened that Russia “will not supply [its] products and agricultural products to [its] enemies” and “will supply food and crops only to [its] friends” (Gijs, 2022)—it has also repeatedly accused Western sanctions of impairing its agricultural exports and the global food security crisis. Setting aside Russia’s contradicting statements as well as the specific exemption of agriculture and fertilizer items from Western sanctions, a private importer from a Western or other “unfriendly” country may still engage in “self-sanctioning” Russian products either voluntarily or because of logistical, shipping, finance, and insurance challenges currently affecting trade transactions with Russia (Quinn, Ribeiro, and Almeida, 2022).
While it is difficult to disentangle the various dimensions of these geopolitical effects, Figure 4 illustrates Russia’s exports of potassium, nitrogen, and phosphate fertilizer to “friendly” and “unfriendly” partner countries in March–December period of 2022 relative to 2019-2021. “Friendly” countries—which include Brazil, India, China, South Africa (BRICS countries) plus Iran, Saudi Arabia, and the United Arab Emirates—have provided some level of public support for Russia, have not publicly condemned Russia’s attack on Ukraine, or have not participated in Western sanctions.
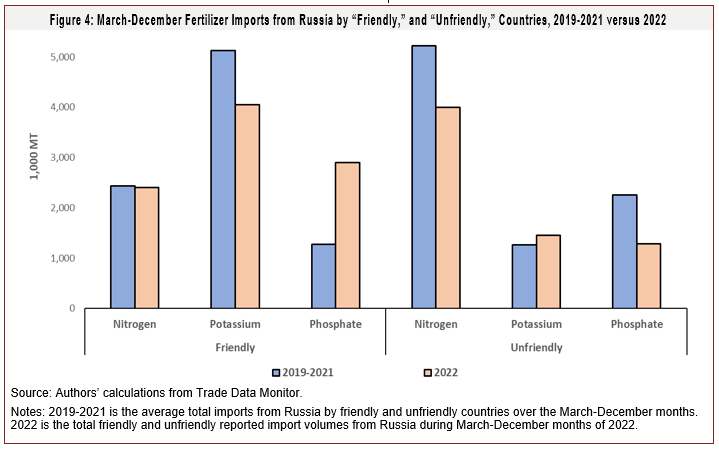
Russian exports of phosphate fertilizer are up over 1.6 MMT to “friendly” countries in 2022, and more than makes up for the decline in phosphate exports of 1 MMT to “unfriendly” countries. Conversely, nitrogen exports of 2.4 MMT to “friendly” countries in 2022 is very close to Russia’s historical average for this fertilizer nutrient. However, Russia’s nitrogen exports to “unfriendly” countries are down 1.2 MMT. One reason for the larger increase of Russian phosphate exports to “friendly” countries in 2022 may be that prior to the war, “unfriendly” countries were a relatively larger destination market (compare 2019-2021 phosphate exports between “friendly” and “unfriendly” groups). Thus, “friendly” markets may have more capacity to absorb additional Russian phosphate exports relative to nitrogen or potassium exports. In efforts to assist its domestic farmers, Russia also extended its quotas on nitrogen fertilizer exports (Reuters, 2022a).
Are Trade Effects Worse for Lower-Income Countries More Reliant on Ukraine?
We return to an important question raised by many international organizations: Are trade losses from Russia’s invasion of Ukraine more severe for lower-income countries? Using wheat and corn as a case study, we illustrate this relationship in Figure 5, which plots the change in countries’ March–December 2022 cumulative wheat and corn import volumes from Ukraine (relative to the average of the same months in the previous five years) on the vertical axis against each country’s average historical March–December (2017–2021) share of wheat and corn imports sourced from Ukraine.
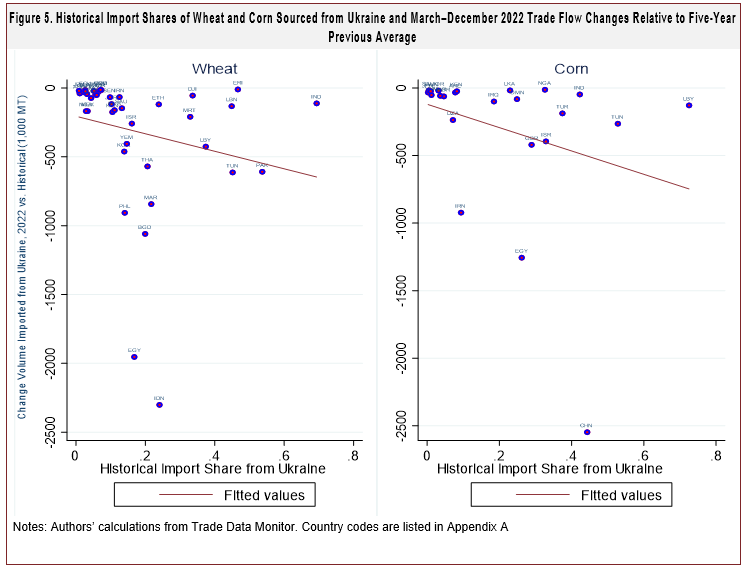
The further down and to the right the scatterplots are (i.e., moving southeast) in the Figure 5, the greater the reduction in import volumes from, and historical reliance on, Ukraine for wheat and corn imports. Although the relationship is not as tight as presumed, the results underscore a general trend: The line of best fit slopes downward, indicating that the negative trade volume effects of the war are increasing, in absolute value, for countries that have been historically more reliant on imports from Ukraine. Egypt is an example of a middle-income country that has relied on 17% of its wheat and 26% of its corn imports—from Ukraine—and has experienced a decline of nearly 2 MMT of wheat and 1.3 MMT of corn in March–December 2022, compared to Egypt’s 2017–2021 average in these same months. Other lower-income countries with relatively high import dependence and larger trade volume reductions include wheat imports into Bangladesh (-1.1 MMT; 20% import reliance on Ukraine), Tunisian wheat (-613,000 MT; 45% reliance) and corn (-265,000 MT; 53% reliance) imports, Moroccan wheat imports (-843,000 MT; 22% reliance), wheat imports into Yemen (-405,000 MT; 15% reliance) and Pakistan (-609,000 MT; 54% reliance), and Libya’s wheat (-426,000 MT; 38% reliance) and corn (129,000 MT; 73% reliance) imports. Indonesian wheat and Chinese corn imports are examples of upper-middle and high-income markets that have been similarly impacted by Russia’s war in Ukraine.
This article provided one of the first looks at the agricultural trade impacts of Russia’s invasion of Ukraine. We found sharp and immediate effects: Russia’s war has reduced Ukraine’s grain and oilseed exports by an average of 52% and 32%, respectively, during March–December 2022. This is equivalent to restricting 23.6 MMT of Ukraine’s potential wheat, corn, barley, and other coarse grain exports in 2022 and an additional 4.6 MMT of vegetable oil, meal, and seed from the global market. These amounts represent nearly 45% and 24% of Ukraine’s average annual global exports in these two sectors, respectively. These trade volume impacts occurred on top of FOB export price discounts due to the war.
Much of the impact of Russia’s invasion on Ukraine’s cereal grain and oilseed exports occurred in the months prior to the BSGI (March–July 2022). Our estimates suggest Ukraine’s cereal grain and oilseed product exports were reduced by 71% and 62%, respectively, during this period. However, in the months following the entry into force of the BSGI (August–December 2022), Ukraine’s cereal grain exports were down just 34% compared to export levels predicted by the model, and its oilseed exports showed no significant impacts.
Our estimated effects on most Russian agricultural and fertilizer exports were not significant. However, we findsome geographical reorientation of Russian fertilizer exports away from “unfriendly” and toward “friendly” countries—particularly for Russian exports of phosphate fertilizer. This is likely leading to shifts in the relative cost of imported fertilizer products that may negatively impacting some countries while benefiting others. However, we leave this analysis to future research.
On November 19, 2022, Russia and Ukraine agreed to extend the BSGI for an additional 120 days to continue Ukrainian grain and oilseed exports from three ports; Odesa, Yuzhny, and Chernomorsk. On March 18, 2023, the BSGI was renewed a second time but only for at least 60 days, or half the time of the previous extension. The BSGI has been one of the only diplomatic breakthroughs since the war began, and even if the deal continues to be honored, our results suggest it will take time to rebuild Ukraine’s port capacity and for traders and inspection officials to kick-start trade flows to levels that existed prior to Russia’s invasion. Ukraine faces the task of clearing a pathway in mined seas, finding enough ships to carry the backlogged grain, rerouting trains and trucks that are now being used elsewhere, and rebuilding storage capacity at these ports. What this means for the many lower-income countries dependent on Ukrainian food exports remains unclear. Much will depend on how easily these markets can source product from other exporters. We leave this and many other important questions for further research.
Abay, K., C. Breisinger, J. Glauber, S. Kurdi, D. Laborde, and K. Siddig. 2022. “The Russia-Ukraine Crisis: Implications for Global and Regional Food Security and Potential Policy Responses.” International Food Policy Research Institute (IFPRI), MENA Working Paper No. 39, May. Available online: https://ebrary.ifpri.org/utils/getfile/collection/ p15738coll2/id/135913/filename/136124.pdf
Abay, K., L. Abdelfattah, C. Breisinger, J. Glauber, and D. Laborde. 2022, March 14. “The Russia-Ukraine Crisis Poses a Serious Food Security Threat for Egypt” [blog post]. IFPRI Blog. Available online: https://www.ifpri.org/blog/russia-ukraine-crisis-poses-serious-food-security-threat-egypt
Arita, S., J. Grant, and S. Sydow. 2021. "Has COVID-19 Caused a Great Trade Collapse? An Initial Ex Post Assessment" Choices, Quarter 3.
Arita, S., J.H. Grant, S. Sydow, and J. Beckman. 2022. “Has Global Agricultural Trade Been Resilient Under Coronavirus (COVID-19)? Findings from an Econometric Assessment.” Food Policy 107:102204.
Chan, K. 2022, June 8. “OECD Slashes Global Economic Outlook on Russia-Ukraine War.” AP News. Available online: https://apnews.com/article/russia-ukraine-covid-health-economic-outlook-government-and-politics-b25de2fb0c02394d8a8f8b915314c726
Durisin, M., A. Quinn, and A. Nardelli. 2022, July 22. “Ukraine's Grain Challenge Involves Clearing Mines, Finding Ships and Trusting Putin” Bloomberg. Available online: https://www.bloomberg.com/news/articles/2022-07-22/ukraine-grain-challenge-clear-mines-find-ships-and-trust-putin
The Economist. 2021, May 27. “Russia Puts Czech Republic on the Official Enemies List.” Available online: https://www.economist.com/europe/2021/05/27/russia-puts-the-czech-republic-on-an-official-enemies-list
Fahim, K. 2022, July 22. “Russia and Ukraine Agree to Release Blockaded Grain Exports.” Washington Post. Available at: https://www.washingtonpost.com/world/2022/07/22/ukraine-grain-deal-turkey-russia/
Food and Agriculture Organization of the United Nations. 2022, June 10. The Importance of Ukraine and the Russian Federation for Global Agricultural Markets and the Risks Associated with the Current Conflict. Rome, Italy: FAO, Information Note. Available online: https://www.fao.org/3/cb9013en/cb9013en.pdf
Gijs, C. 2022, April 1. “Russia Threatens to Limit Agri-Food Supplies Only to ‘Friendly’ Countries.” Politico. Available online: https://www.politico.eu/article/russias-former-president-medvedev-warns-agricultural-supplies-restricted-to-friendly- countries/
Giles, C. 2022, May 23. “IMF Chief Warns Global Economy Faces ‘Biggest Test since Second World War’.” Financial Times. Available online: https://www.ft.com/content/1216689a-bd18-4254-bc7c-8a9c5d25cbc3
Glauber, J., and D. Laborde. 2022, May. “How Russia’s Invasion of Ukraine Is Affecting Global Agricultural Markets.” American Enterprise Institute (AEI) Agricultural Policy Studies Report. Available online: https://www.aei.org/research-products/report/how-russias-invasion-of-ukraine-is-affecting-global-agricultural-markets/
Glauber, J., D. Laborde, and A. Mamun. 2022, April 13. “From Bad to Worse: How Russia-Ukraine War-Related Export Restrictions Exacerbate Global Food Insecurity” [blog post]. IFPRI Blog. Available online: https://www.ifpri.org/blog/bad-worse-how-export-restrictions-exacerbate-global-food-security
Grant, J.H., and S. Sydow. 2019. “The Economic Impacts of Trade Retaliation on U.S. Agriculture: A One-Year Review." Choices, Quarter 4.
Grant, J.H., S. Arita, C. Emlinger, R. Johansson, and C. Xie. 2021. “Agricultural Exports and Retaliatory Trade Actions: An Empirical Assessment of the 2018/2019 Trade Conflict.” Applied Economic Perspectives and Policy 43(2):619–640.
Grant, J.H., S. Arita, C. Emlinger, S. Sydow, and M. Marchant. 2019. ”The 2018–2019 Trade Conflict: A One-Year Assessment and Impacts on U.S. Agricultural Exports.” Choices, Quarter 4.
Herszenhorn, D.M. 2022, June 6. “At UN, EU’s Michel Blames Russia for Food Crisis.” Politico. Available online: https://www.politico.eu/article/at-un-michel-blames-russia-for-food-crisis/
Jones, K., and F. Nti. 2022. Impacts and Repercussions of Price Increases on the Global Fertilizer Market. Washington, DC: USDA Foreign Agricultural Service, Global Market Analysis Modeling Team Research Note, June. Available online: https://www.fas.usda.gov/sites/default/files/2022-06/IATR Fertlizer Final_0.pdf
Laborde, D. 2022. Food and Fertilizer Export Restrictions Tracker. Available online: https://public.tableau.com/app/profile/laborde6680/viz/ExportRestrictionsTracker/FoodExportRestrictionsTrackerr
Myers, S., and V. Nigh. 2021. “Too Many to Count: Factors Driving Fertilizer Prices Higher and Higher.” American Farm Bureau Federation Market Intel Report, December. Available online: https://www.fb.org/market-intel/too-many-to-count-factors-driving-fertilizer-prices-higher-and-higher
Nhemachena, C., S. Dahiya, I. Gokah, P. Echessah, M. Gichuri, S. Nhlengethwa, A. Djido, and D. Muthini. 2022. The Impacts of the Russia-Ukraine Conflict on Food Prices, Food and Nutrition Security in Africa. AGRA Regional Food Trade and Resilience Unit, Policy and State Capability Division, Regional Food Trade Policy Brief RFT-A02, March. Available online: https://agra.org/wp-content/uploads/2022/04/Impacts-of-the-Russia-Ukraine-conflict-2.pdf
Quinn, A., T.V. Ribeiro, and I. Almeida. 2022, July 21. “US Banks Keep Financing Trade of Russian Crops as EU Peers Balk.” Bloomberg. Available online: https://www.bloomberg.com/news/articles/2022-07-21/us-banks-keep-financing-trade-of-russian-crops-as-eu-peers-balk
Paulson, N., J. Janzen, C. Zulauf, K. Swanson, and G. Schnitkey. 2022, February 28. “Revisiting Ukraine, Russia, and Agricultural Commodity Markets.” farmdoc daily 12:27.
Polansek, T., and A. Mano. 2022, March 23. “As Sanctions Bite Russia, Fertilizer Shortage Imperils World Food Supply.”Reuters. Available online: https://www.reuters.com/business/sanctions-bite-russia-fertilizer-shortage-imperils-world- food-supply-2022-03-23/
Reuters. 2022a, May 31, . “Russia Extends Quotas for Fertiliser Exports to Help Domestic Farmers.” Reuters. Available online: https://www.reuters.com/article/ukraine-crisis-russia-fertilisers/russia-extends-quotas-for-fertiliser-exports-to- help-domestic-farmers-idUSKBN2NH1G4
———. 2022b, June 22. “Russia Says West Is Spreading Lies about Causes of World's Food Crisis.” Reuters. Available online: https://www.reuters.com/world/europe/russia-says-west-is-spreading-lies-about-causes-worlds-food-crisis- 2022-06-22/
Smith, A. 2023. “The World Food Situation Before and After Russia Invaded Ukraine.” Choices, Quarter 4.
Steinbach, S. 2022. “Port Congestion, Container Shortages, and U.S. Foreign Trade.” Economic Letters 213: 110392.
United Nations. 2022. Operational Data Portal: Ukraine Refugee Situation. Available online: https://data.unhcr.org/en/situations/ukraine/location?secret=unhcrrestricted
U.S. Department of Agriculture, 2022. World Agricultural Supply and Demand Estimates: July 12, 2022, Report. Washington, DC: USDA Office of the Chief Economist. Available online: https://www.usda.gov/oce/commodity/wasde/wasde0722.pdf
U.S. Department of the Treasury. 2022. OFAC Food Security Fact Sheet: Russia Sanctions and Agricultural Trade. Available online: https://home.treasury.gov/system/files/126/russia_fact_sheet_20220714.pdf
Westhoff, P., J. Whistance, J. Cooper, and S. Meyer. 2023. “Impacts of Russia’s invasion of Ukraine on U.S. agriculture,” Choices, Quarter 4
World Bank. 2022. Commodity Markets Outlook: The Impact of the War in Ukraine on Commodity Markets: A World Bank Report. Washington, DC: World Bank, April. Available online: https://openknowledge.worldbank.org/bitstream/handle/10986/37223/CMO-April-2022.pdf
World Food Programme. 2022. “Failing to Open Ukrainian Ports Means Declaring War on Global Food Security, WFP Chief Warns UN Security Council.” WFP Media. Available online: https://www.wfp.org/news/failing-open-ukrainian-ports- means-declaring-war-global-food-security-wfp-chief-warns-un