The invasion of Ukraine has had profound impacts on the farm and food sector (Grant, Arita, and Thompson, 2022). For one thing, it has limited Ukraine’s exports of grain and vegetable oil, pushing up prices in global agricultural commodity markets (Smith, 2022; Glauber and Laborde, 2023). In addition, economic sanctions and other market disruptions have reduced Russia’s exports of petroleum and natural gas, contributing to higher prices for fuel, fertilizer, and other farm inputs. The net effect is to increase both revenues and costs for U.S. farmers and to raise the price of food paid by consumers.
We use the modeling system maintained by the Food and Agricultural Policy Research Institute (FAPRI; Gerlt and Westhoff, 2019) to develop preliminary estimates of the impact of the war on U.S. agriculture. We do this by comparing a scenario that incorporates possible effects of the war on agricultural commodity and input markets to a scenario that does not.
The starting point for the analysis is FAPRI’s 2022 baseline outlook (FAPRI, 2022), which was prepared based on information available before the Russian invasion of Ukraine in February 2022. For both the “war” and “no-war” scenarios, we updated that baseline for some developments not related to the war, such as the smaller-than-anticipated soybean crop in South America and the effect of unfavorable weather on 2022 U.S. winter wheat production. All quantitative analysis for this paper was completed in June 2022. Subsequent developments, both in the war and in agricultural markets, are not incorporated in the estimates. The focus is on the question, “How much difference did the invasion make?” and not on the question, “What is the current outlook for agricultural markets?”
Various researchers have developed early estimates of the war in Ukraine on global agricultural markets (Food and Agriculture Organization of the United Nations, 2022; OECD-FAO, 2022). The USDA’s June 2022 World Agricultural Supply and Demand Estimates (U.S. Department of Agriculture, 2022a) provide a basis for some of the assumptions used to conduct our analysis (Table 1). In the two marketing years prior to the war, Ukraine exported an average of 19 million metric tons (MT) of wheat and 26 million MT of corn. For the 2022/23 marketing year (the year beginning with the 2022 harvest), the USDA estimated those exports would be reduced to 10 million MT of wheat and 9 million MT of corn. This 26-million-MT reduction of Ukraine’s exports of wheat and corn combined is comparable to total U.S. exports of wheat in a typical year.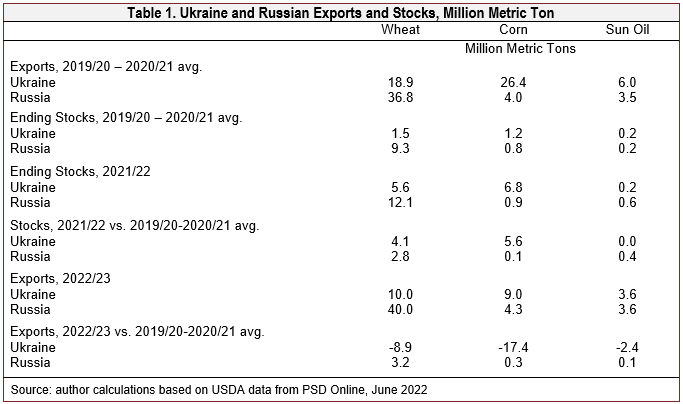
The Russian invasion occurred in February 2022, near the midpoint of the 2021/22 marketing year. Much of Ukraine’s grain and sunflower oil had already moved into international markets before the war broke out, but exports have been severely restricted in recent months. The USDA estimated that Ukraine’s stocks of both wheat and corn would be much higher than normal at the end of the 2021/22 marketing year. Sanctions and other disruptions may also have had a modest impact on limiting Russia’s exports of the same products in 2021/22.
We assume that the reported increase in Ukraine and Russia’s grain stocks in 2021/22 relative to the average of the previous two years is an indicator of how much additional grain the two countries might have exported had it not been for the war. Thus, we shift the export demand curve for U.S. wheat by 6.9 million MT (253 million bushels) and the export demand curve for corn by 5.7 million MT (227 million bushels). These shifts would reflect the change in U.S. exports in 2021/22 if prices had remained at the level of the no-war scenario. However, this shift in demand results in higher prices, meaning that the net change in U.S. exports is much smaller, as the quantities supplied, used, and traded in global markets adjust. Changes in trade patterns due to the conflict are discussed in detail in Grant, Arita, and Sydow (2022).
This approach is less useful in the case of vegetable oil. The USDA’s June 2022 estimates suggested that Ukraine and Russian stocks of sunflower oil were only mildly affected by the war, but exports were nevertheless lower than in recent years. We assumed a 1.3 million MT (2.9 billion pound) shift in the demand for U.S. vegetable oil exports in 2021/22. As with the grains, the net change in U.S. vegetable oil exports was much smaller, as higher prices affected global supply, demand, and trade.For 2022/23, it was not adequate to consider only the USDA’s estimates of the change in Ukraine and Russia’s exports compared to recent averages in determining the magnitude of shifts to impose. One reason is that the USDA June projected prices for 2022/23 already incorporated effect of the war, and were therefore higher than they would have been in a no-war scenario. If it had not been for the war, both Russia and Ukraine might well have produced and exported more grain than the recent average, given the
prices projected in the war scenario. Thus, the export demand shifts we imposed on the model are larger than the projected decline in Ukraine’s exports from the 2019/20 to 2020/21 average—16.3 million MT (600 million bushels) for wheat, 22.9 million MT (900 million bushels) for corn, and 1.4 million MT (3 billion pounds) for vegetable oil. For 2023/24 and subsequent years, we assumed smaller impacts on export demand, implicitly assuming either an end to the war or agreements that would facilitate a move toward more normal production and trade.
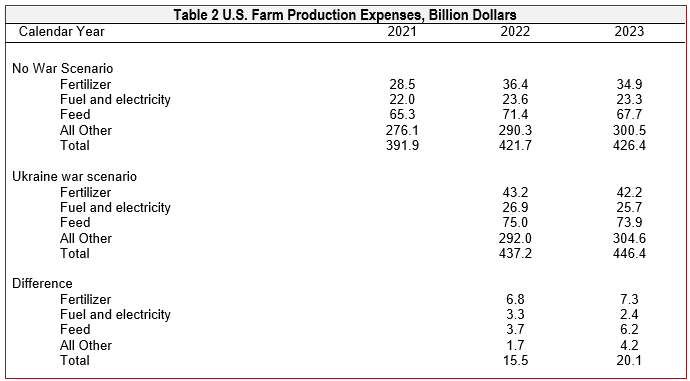
The war has also affected markets for fuel, fertilizer, and other inputs. Considering observed changes in prices of petroleum and other products since the invasion, we developed an alternative set of projections for farm input costs. The net effect of these assumptions and endogenous responses in the model is to increase U.S. farm production expenses in the war scenario by $15.5 billion in 2022 relative to the no-war scenario. In absolute terms, the largest impacts are on fertilizer, fuel, and feed, with feed cost increases primarily a function of higher prices for corn and other feedstuffs.
We projected a $30 billion increase in farm production expenses in 2022 relative to 2021 even before considering impacts of the war. Fertilizer prices, for example, had already increased sharply because of strong farm commodity prices, high natural gas prices in Europe, tariffs on some imported fertilizer products, pandemic-related supply disruptions, and a host of other factors. The war resulted in further increases in prices for petroleum and natural gas, and these contributed to additional increases in fertilizer prices, even though fertilizer exports by Russia were explicitly exempted from sanctions. We assume that these input market effects persist in 2023 before moderating in later years.
As is always the case, these assumptions about war-related shifts in farm commodity and input markets are tentative, based on preliminary information and a number of strong but reasonable assumptions. It is safe to assume that actual market shifts will ultimately prove to be different, perhaps significantly so, from those assumed here.
For example, the analysis assumes that the war at least slightly restrains Russian grain exports because of sanctions on financial institutions and the expected reluctance of some importers to purchase Russian products. However, since June 2022, there has been little evidence that Russia is facing major obstacles in selling its grain and oilseed products. Indeed, Russia appears to be harvesting a record wheat crop in 2022, and in its September 2022 estimates, the USDA forecast record Russian wheat exports in the 2022/23 marketing year (U.S. Department of Agriculture, 2022b), and up 6.5% from the June estimate. Similarly, the analysis does not consider impacts of the United Nations-sponsored Black Sea Grain Initiative, agreed to on July 22, 2022, that allowed grain from Ukraine to be exported through the Black Sea from particular ports (United Nations, 2022).
The estimated effect of these assumed shifts in U.S. export demand and farm production expenses is to raise U.S. exports and prices of grains, oilseeds, and other agricultural products (Table 3). The largest impacts occur in the 2022/23 marketing year, when U.S. exports of wheat and corn exceed those in the no-war scenario by 15% and 29%, respectively.
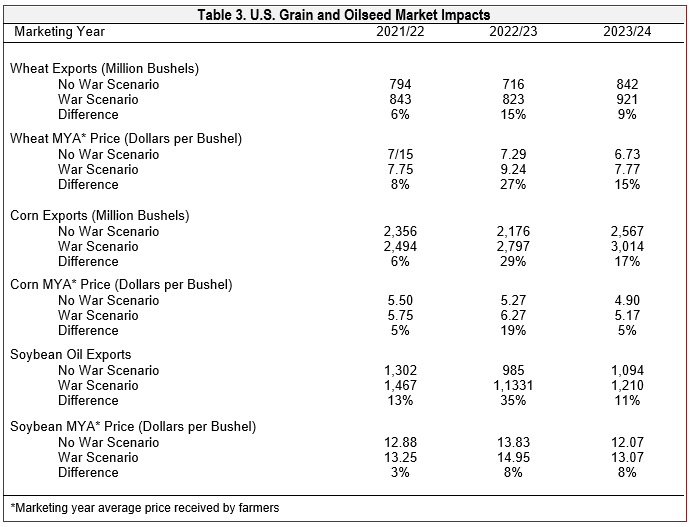
Even though the projected increase in U.S. wheat prices (27% above prices in the no-war scenario) is greater than the increase in corn prices (19%), the increase in wheat exports is smaller. One reason is that exports are a much smaller share of U.S. corn demand than is the case for wheat, so corn exports can more easily increase by reducing other uses. A second reason is that the 2022 winter wheat crop had already been seeded when Russia invaded Ukraine, so producers’ ability change 2022 wheat production was limited.
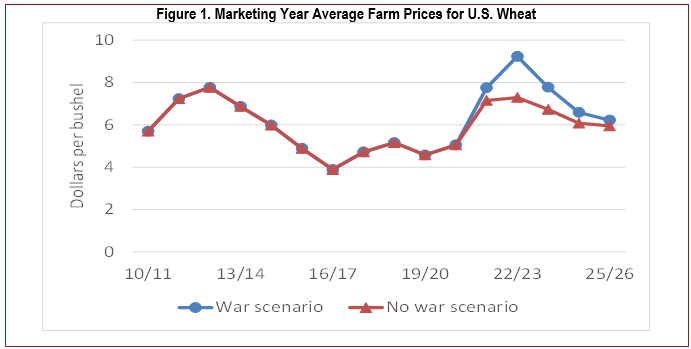
To put these estimated impacts into context, consider projected wheat prices relative to recent history (Figure 1). In nominal terms, the 2021/22 wheat marketing year average price in the war scenario is very close to the previous record set in the drought year of 2012/13. The price rises to over $9/bushel in 2022/23 before declining in subsequent years, given the assumption of a return toward normality in world markets. Note that the USDA’s June 2022 estimate of 2022/23 U.S. wheat prices was even higher, at $10.75/bushel, but grain futures prices fell in late June to levels more consistent with the projections reported here; by September, the U.S. Department of Agriculture (2022b) had reduced its projection of 2022/23 wheat prices to $9.00/bushel.
In the case of soybeans, the increase in prices relative to the baseline can be explained primarily by two factors. First, the reduction in sunflower oil exports from Ukraine provides a significant boost to U.S. exports and prices for
soybean oil, a commodity that can substitute for sunflower oil in some uses. Second, other cross-commodity effects are also important. The larger increase in U.S. corn prices results in a shift from soybean to corn production in the war scenario, especially in 2023/24. Likewise, higher competing crop prices reduce acreage devoted to cotton and several other crops. The net result is an increase in the prices for all major field crops in the war scenario relative to the no-war scenario.
Our estimated price impacts are larger than those of other analyses of the price impacts of the conflict but are difficult to compare given unknown differences in assumptions. FAO’s “moderate” scenario from March 2022 found that 2022 impacts relative to a preinvasion baseline were wheat prices up by nearly 9%, corn up by 8%, and “other oilseeds” up by 11% (Food and Agriculture Organization of the United Nations, 2022). The biggest difference between our estimates and theirs is on oilseeds, but these results are not directly comparable as FAO’s oilseed category includes more than just soybeans and are calendar year instead of marketing year. The increase in calendar year 2022 prices in the initial (nonpublic) version of the OECD-FAO 2022-2031 outlook versus the final public version (OECD-FAO, 2022) that accounted for the conflict was 6% for wheat, 7% for corn, and 3% for soybeans.
OECD-FAO's 2022-2031 Outlook (OECD-FAO, 2022) provides a sensitivity analysis of the impacts of the conflict on wheat prices for the 2022/2023 marketing year that shows substantially lower price impacts than our result. For an unspecified production cost increase and for a 50% decrease in Ukraine wheat exports and no change in Russian wheat exports, they find a wheat price increase of 9%, in contrast to our 27%.
While it is important to recognize that futures prices are affected by a wide range of factors unrelated to the war, it is interesting to note that July 2022 Chicago wheat futures prices increased from $7.82/bushel on February 16, 2022, to $12.77 on May 17 before dropping back to $8.69 on June 30 (Barchart, 2022).
The war in Ukraine increases both the value of farm product sales and farm production expenses (Table 4). Higher prices are primarily responsible for the estimated $16.6 billion increase in 2022 crop cash receipts in the war scenario relative to the no-war scenario. Production expenses increase by a similar amount in 2022, $15.5 billion, and there are only small changes in other components of the farm income accounts. As a result, net farm income is nearly identical in the war scenario as in the no-war scenario in 2022, and the 2022 value is also very close to the USDA-reported value of $119 billion in 2021 (the USDA subsequently revised the estimate of2021 net farm income upwards, primarily because of a downward revision of its estimates of farm production expenses). Note that all of these estimates are based on a series of assumptions; even a slight change in one or more assumptions could change the direction of impacts on net farm income.
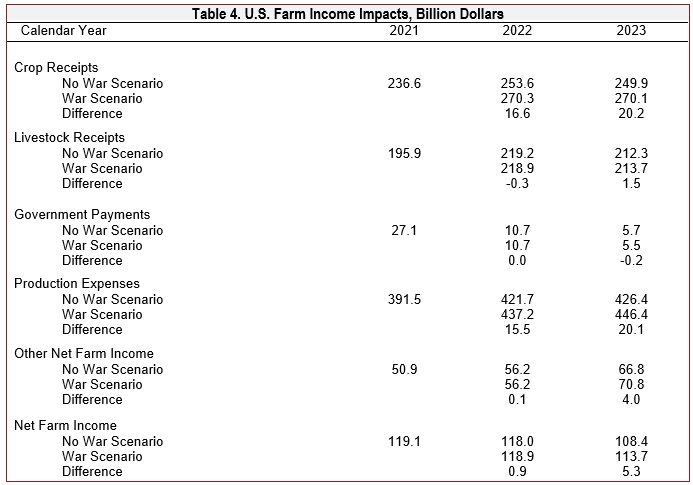
In 2023, the balance of effects on farm income is again very even. Livestock sector sales receipts increase slightly, as the impact of higher feed costs both reduces meat and milk production and raises livestock sector prices, with the latter effect dominating. The net income of livestock producers is reduced in the war scenario, as the increase in feed and other costs outweighs the increase in gross revenues from sales. What is labeled as “other net farm income” increases for a variety of reasons in the war scenario. One reason is that higher commodity prices increase the value of crops insured and thus the expected value of crop insurance indemnity payments. Note that net farm income declines in 2023 relative to 2022 in both the war and no-war scenarios, as sales and government payments decline while production expenses continue to increase.
Government payments (which do not include crop insurance indemnities) are reduced somewhat in the war scenario, as prices for most crops are too high to generate significant payments under either the Agriculture Risk Coverage (ARC) or Price Loss Coverage (PLC) programs. Under those programs, payments for the 2022/23 crop are mostly made in October 2023.
In the war scenario, 2022 consumer food price inflation is 6.0%, well above the 4.5% in the no-war scenario (Table 5). Higher farm commodity prices account for much of the increase in consumer food prices, but higher energy prices increase the cost of processing and transportation, and other food sector costs increase as well. Actual food price increases in 2022 have been even greater. For example, the consumer food price index for food was 11.4% above year-ago levels in August 2022 (U.S. Bureau of Labor Statistics, 2022). In contrast to most recent years, supermarket food prices have increased more rapidly than food-away-from-home prices; in August 2022, food-at-home prices were up 13.5% from the same month in 2021.
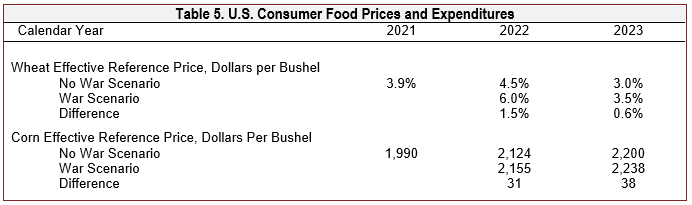
Consumer food expenditures have rebounded from the pandemic-induced reduction in 2020. In the war scenario, 2022 expenditures are $31 billion (1.4%) higher than in the no-war scenario. In dollar terms, this increase is even greater than the increase in farm cash receipts, primarily because of assumed war-related increases in energy and other costs. Consumer food price inflation in the war scenario continues to exceed no-war scenario levels in 2023, and the increase in consumer food expenditures is therefore slightly larger in 2023 than in 2022. These effects moderate in later years. Note that in real terms, consumer food expenditures are slightly reduced. In 2022, for example, the increase in nominal food expenditures (1.4%) is slightly less than the increase in consumer food prices (1.5%).
Short-term impacts on payments under current farm commodity programs are small, but higher commodity prices could increase the value of 2023 crop insurance indemnities by increasing the value of crops insured. While most of the impacts of the war tend to fade over time given the assumptions of this analysis, there is an interesting anomaly in the case of payments under the ARC and PLC programs (Table 6). Higher prices in the near term affect the moving average of prices used to compute ARC benchmark revenue and the effective reference price used to calculate PLC payments. Under provisions of the 2018 Farm Bill, effective reference prices can exceed the statutory minimums if a moving average of prices exceed those levels by a sufficient amount. For the 2025/26 crop, for example, the relevant period used to compute the moving averages is 2019/20 to 2023/24 for both ARC and PLC.
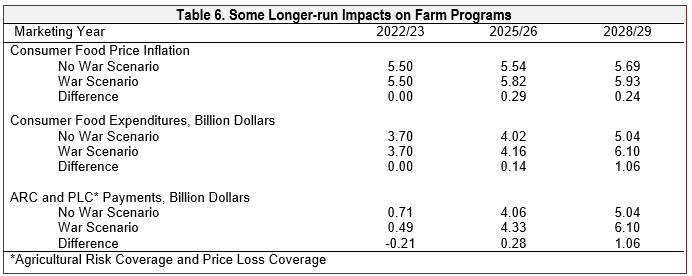
The estimates of ARC and PLC payments, as with other estimates reported here, are mean values from 500 stochastic solutions for both the war and no-war scenarios. Even though mean projected prices exceed the projected effective reference prices for most commodities, PLC payments occur in some of the 500 outcomes where the projected price is less than the average and less than the effective reference price. Note that by 2028/29, projected ARC and PLC payments in the war scenario are over $6 billion, much higher than they are in the near term. This could have implications for the next farm bill debate, as new legislation will be affected by Congressional Budget Office estimates of the budgetary cost of current and prospective new legislation.
This analysis suggests that the war in Ukraine is likely to result in higher farm commodity prices, higher crop cash receipts, higher farm production expenses, and higher consumer food costs, with only small effects on aggregate net farm income. Given the assumptions of the analysis, U.S. wheat, feed grain, and oilseed producers are likely to be net beneficiaries of the war, as the war-induced increase in commodity prices outweighs the increase in production expenses, while the reverse is likely to be true for livestock producers facing higher feed costs.
The results, as always, are sensitive to both assumptions and model parameters. It is easy to imagine scenarios where the impacts on production costs (or crop receipts) are much larger or smaller than estimated here. There is also a question of how to attribute certain market events. For example, the Federal Reserve has taken steps to fight inflation by raising short-term interest rates. If one reason they are doing so is to offset the impacts of the Ukraine war on inflation in food and energy prices, one might argue that the analysis here should have attributed to the war at least a portion of the observed change in interest rates.
Finally, it is important to recognize that the actual course of the war in Ukraine is uncertain as this is written. Even a quick resolution of the war at this point would not eliminate many of the market impacts reported here, but further escalation could have even greater impacts on world agricultural markets and the global economy, as well as on all the people directly affected by the war itself.
Barchart. 2022. Commodities Prices. Available online: https://www.barchart.com/futures/major-commodities.
Food and Agricultural Policy Research Institute. 2022. “U.S. Agricultural Market Outlook.” Columbia, MO: University of Missouri, Food and Agricultural Policy Research Institute, FAPRI-MU Report #02-22.
Food and Agriculture Organization of the United Nations. 2022, March 11. “Global Food Markets and Prices.” Extraordinary Meeting of the G7 Agriculture Ministers. Rome, FAO. Available online: https://www.fao.org/3/cb9014en/cb9014en.pdf.Gerlt, S., and P. Westhoff. 2019. FAPRI-MU Stochastic U.S. Crop Model Documentation. Columbia, MO: University of Missouri, Food and Agricultural Policy Research Institute, FAPRI-MU Report #05-19.
Glauber, J., and D. Laborde. 2023. “Global Agricultural Markets in Flux.” Choices, forthcoming.
Grant, J.H., S. Arita, and W. Thompson, 2022. “Theme Overview: Turmoil in Global Food and Agricultural Markets: Implications of Russia’s Invasion of Ukraine.” Choices, forthcoming.
Grant, J.H., S. Arita, and S. Sydow. 2022. “Agricultural Trade and Global Reallocations Following Russia’s Invasion of Ukraine.” Choices, forthcoming.
OECD-FAO. 2022. OECD-FAO Agricultural Outlook 2022-2031. Organisation for Economic Co-operation and Development and Food and Agriculture Organization of the United Nations. Available online: https://www.agri-outlook.org/.
Smith, A. 2022. “Russia, Ukraine and Food Supply: An Updated Look at the Prices.” Choices, forthcoming.
United Nations. 2022, September 16. “The Black Sea Grain Initiative: What It Is and Why It Is Important for the World.” Available online: https://news.un.org/en/story/2022/09/1126811.
U.S. Bureau of Labor Statistics. 2022. Consumer Price Index (CPI) Databases. Available online: https://www.bls.gov/cpi/data.htm.
U.S. Department of Agriculture. 2022a, June 10. “World Agricultural Supply and Demand Estimates.” Washington, DC: USDA, WASDE-625. Available online:
https://downloads.usda.library.cornell.edu/usda-esmis/files/3t945q76s/pv63h524n/9c67xt79f/wasde0622.pdf
———. 2022b, September 12. “World Agricultural Supply and Demand Estimates.” Washington, DC: USDA, WASDE-628, U.S. Available online: https://downloads.usda.library.cornell.edu/usda-esmis/files/3t945q76s/7p88dr073/1v53m537g/wasde0922.pdf

